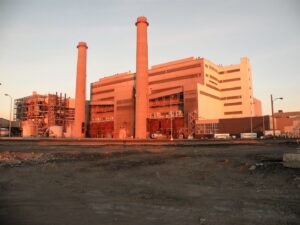
Coal-fired power plants are the primary source of electricity in the U.S. and generate an estimated 50% of the electricity we use every day. They also are the major domestic, man-made source of mercury entering our atmosphere, according to the “EPA’s Roadmap for Mercury” (PDF, p. 22). Since mercury is toxic in all forms, bio-accumulates as it moves up the food chain, and is highly mobile, efforts such as the Great Lakes Initiative (GLI) concentrate on eliminating mercury at its source.
The Clean Air Mercury Rule (CAMR), part of the Clean Air Act, establishes lower mercury emission targets that coal-fired power plants must meet in the years 2010 and 2018. Despite the recent court decision to vacate the federal law, at least 16 states are independently pursuing implementation of key components of the rule, some employing more stringent emission standards and establishing tighter implementation schedules.
Though some mercury reductions result as a cobenefit of acid rain prevention systems, further reductions are possible with commercially available technologies such as activated carbon injection. CAMR, as it was originally written, included a provision for cap-and-trade incentives to reward sites with low mercury emissions and, thus, encourage cleaner operation. In this case, each coal-fired power plant would continuously monitor the mercury it emits to qualify for these incentives.
Until recently, most mercury monitoring was performed using the Ontario Hydro Method or a dedicated mercury continuous emissions monitor (CEM). With the Ontario Hydro Method a portion of the stack gas is diverted and bubbled through chemical solutions that capture the mercury. These solutions are transported to a lab and analyzed for mercury by cold vapor atomic absorption spectroscopy (CVAAS). CEMs also divert a portion of the stack gas, but the analyzer is mounted on the stack. Appendix K of the CAMR introduced a simple, reliable new mercury monitoring technique that involves trapping the mercury on sorbent material.
Back of the Book
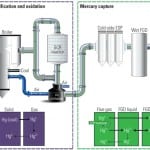
In the Appendix K approach, traps filled with halogenated activated carbon (the sorbent) are placed directly in the stack downstream of all mercury scrubbing equipment. A small portion of the stack gas is then drawn through the sorbent, where the mercury is captured. After an appropriate collection period, the traps are removed and the mass of mercury trapped on the sorbent is measured. Knowing the flow rate of gas out of the stack, the flow rate of gas through the trap, and the mass of mercury on the sorbent, the analyst can then calculate the total mercury discharged from the stack while the trap was installed (Figure 1).
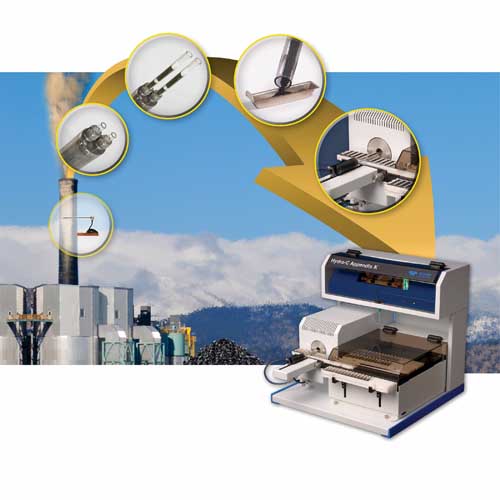
1. The Appendix K trapping and subsequent measurement processes. Courtesy: Teledyne Leeman Labs
Two types of mercury monitoring are required of coal-fired power plants: continuous emission monitoring (CEM) and periodic Relative Accuracy Test Audit (RATA). The approach of trapping mercury in sorbent tubes with subsequent analysis by atomic spectroscopy can fulfill both CEM and RATA requirements. By collecting stack emissions over an extended time period (up to seven days) a record of the total mercury emitted can be maintained. Alternatively, for power plants that already have on-line Hg CEM systems, sorbent traps can provide the RATA confirmation that is required.
One of the more attractive approaches for these analyses is provided by the Hydra-C Appendix K from Teledyne Leeman Labs, shown in Figure 1. The Hydra-C Appendix K uses thermal decomposition followed by gold amalgamation and atomic absorption spectroscopy for the analysis. This approach provides very short analysis times because there is no sample digestion process. Further, unlike mercury techniques that are based on the analysis of liquid samples, thermal decomposition uses no hazardous chemicals and produces no hazardous waste.
The analytical requirements for CEM with the sorbent trap approach and RATA testing are somewhat different. RATA certification is required once per year and typically involves a stack testing team going to the power plant to confirm the accuracy of the on-line CEMs. In this case, high sensitivity is paramount because the shorter the collection period, the less time the analysis team must remain on-site and, thus, the lower the cost of the analysis.
On the other hand, for CEM with sorbent traps it is desirable to have a wide dynamic range (or less sensitivity) so that sorbent traps can be replaced at reasonable intervals (three to seven days). The Hydra-C has both the high sensitivity and wide dynamic range necessary to satisfy the requirements of the two mercury measurements.
Sorbent Tube Design
Sorbent traps consist of glass tubes packed with three sections of sorbent material separated by glass wool spacers (Figure 2). Typically, the sorbent material is halogenated activated charcoal (brominated and iodinated traps are available). The section near the end of the trap that protrudes into the stack is called the analytical section, and it is here that all the mercury from the stack gas should collect. The second section is called the breakthrough section, and a lack of Hg in this section serves as confirmation that the mercury was quantitatively collected on the analytical section. The third section is the spike section, where a calibrated amount of mercury is deposited by the sorbent trap manufacturer.

2. A typical sorbent trap used to collect a mercury sample from stack gas. Courtesy: Teledyne Leeman Labs
Because this is a performance-based method, it depends on quality controls to demonstrate the accuracy of the test results. These controls are supported by using a pair of sorbent traps for each stack test. The quality control (QC) criteria of the method require that the analytical sections of the paired traps agree to within 10% relative deviation and that the breakthrough sections show less than 5% of the mercury found in the analytical section. For the spike section, the recovery must be within 75% to 125% of the known value. Additionally, the calibration must be linear (r2 ≥0.99) and each standard must be accurate (within 10% of true value). A number of other parameters are relevant to the mercury levels reported, such as gas flow, atmospheric pressure, and moisture. None of these will be discussed here but are covered in detail in CAMR.
Sampling Sources
A total of 18 runs of sorbent trap samplings were performed at the stacks of five units in three power plants. During the sampling, the tested boiler was operated at its full-load conditions (Table 1).

Table 1. Configurations of tested boilers and stack gas parameters. All tests were conducted using bituminous coal. Source: Teledyne Leeman Labs
One of the samples from each sample pair was analyzed using a Hydra-C Appendix K system and the other sample from the pair was analyzed using another commercially available mercury analyzer employing thermal decomposition (identified in Table 3 as Instrument A). The instrument conditions for the Hydra-C Appendix K system appear in Table 2.

Table 2. Instrument conditions during test. Source: Teledyne Leeman Labs
Comparing Data
Table 3 shows the raw data for the Hydra-C Appendix K. Clearly, the breakthrough is well below the required 5% limit calculated as 100 x the mass of Hg in the breakthrough section divided by the mass of Hg in the analytical section.

Table 3. Comparison of different mercury testing methodologies and instruments. Source: Teledyne Leeman Labs
Table 3 also compares the analytical results from different instruments corrected to total stack emissions. It shows that there was a slight difference in measured value between the two instruments. The result for parallel testing (traps A and B) is required to be within 10% difference by Method 30B criteria (PDF) [[http://www.epa.gov/ttn/emc/promgate/Meth30B.pdf]]. Also note that in most cases the results from both Instrument A and Leeman Hydra-C Appendix K meet the QA/QC criteria for analysis, even though the traps were analyzed using two different instruments. It is logical to expect pair correlation to be better using a single analyzer. The primary differences between Analyzer A and the Hydra C are that the Hydra C provides extensive automation of the data reduction and sample handling process and also provides the analytical capabilities to meet the requirements of both continuous monitoring and RATA testing required on CEMS.
The use of sorbent traps together with atomic absorption detection to monitor mercury stack emissions clearly provides the reliable data needed to report on the efficiency of mercury abatement equipment and to qualify for “clean” operation incentives. The thermal decomposition technique employed by the Hydra-C Appendix K removes the sometimes complicated chemistry required to put solid samples into solution and also provides a highly automated approach to both CEM and RATA monitoring.
—Dr. Wei-Ping Pan (wei-ping.pan@wku.edu) is Sumpter Professor of Chemistry, Dr. Chin Ming Cheng (chin-min.cheng@wku.edu) is manager of the Emission Laboratory, and Chien-Wei Chen (chein-wei.chen@wku.edu) is assistant director for analysis development at the Institute for Combustion Science and Environmental Technology, Department of Chemistry, University of Western Kentucky. David L. Pfeil (dpfeil@teledyne.com) is product manager for Teledyne Leeman Labs.