A new report from the Department of Energy (DOE) highlights sizeable increases in U.S. wind power capacity and recent improvements in the cost and performance of wind power technology, but it says the U.S. continues to trail several countries in wind energy penetration and warns that the industry is facing "serious federal policy uncertainty" looking into 2013 and beyond.
According to the 2011 Wind Technologies Market Report, roughly 6.8 GW of new wind capacity was added to the U.S. grid last year. Factors driving growth in 2011 included continued state and federal incentives for wind energy, improvements in the cost and performance of wind power technology, and "the need to meet an end-of-year construction start deadline in order to qualify for the Section 1603 Treasury grant program," the DOE says in its report. However, the industry faces uncertainty with the expiration of the production tax credit (PTC) at the end of this year, it says. Lower natural gas prices and modest electricity demand growth have also threatened to dramatically slow new wind farm builds in 2013, it says.
Among other key findings in the report are that wind power installations in 2011, at an investment of $14 billion, were 31% higher than in 2010, but still well below the levels seen in 2008 and 2009. Cumulative wind power capacity grew by 16% in 2011, bringing the total to nearly 47 GW. Wind installations made up 32% of all generating capacity additions last year—though they were still behind natural gas in terms of gross capacity added to the U.S. grid.
U.S. Lags in Capacity Additions, Wind Energy Penetration, Offshore Installations
For the third year in a row, the U.S. trailed China as the world’s second-largest market in annual and cumulative wind capacity additions, the report finds. But the U.S. lagged far behind other countries in wind energy penetration: "A number of countries are beginning to achieve relatively high levels of wind energy penetration in their electricity grids: end-of-2011 wind power capacity is estimated to supply the equivalent of roughly 29% of Denmark’s electricity demand, 19% of Portugal’s, 19% of Spain’s, 18% of Ireland’s, and 11% of Germany’s. In the United States, the cumulative wind power capacity installed at the end of 2011 is estimated, in an average year, to equate to roughly 3.3% of the nation’s electricity demand."
No offshore turbines have yet been commissioned in the U.S., compared to global offshore capacity of 4 GW, the vast majority in Europe, the report concedes. However, it says, "significant strides have been made recently in the federal arena, through both the Department of the Interior’s responsibilities with regard to regulatory approvals and the Department of Energy’s investments in offshore wind R&D." About 10 projects with an estimated total capacity of 3,800 GW are in the pipeline, it says.
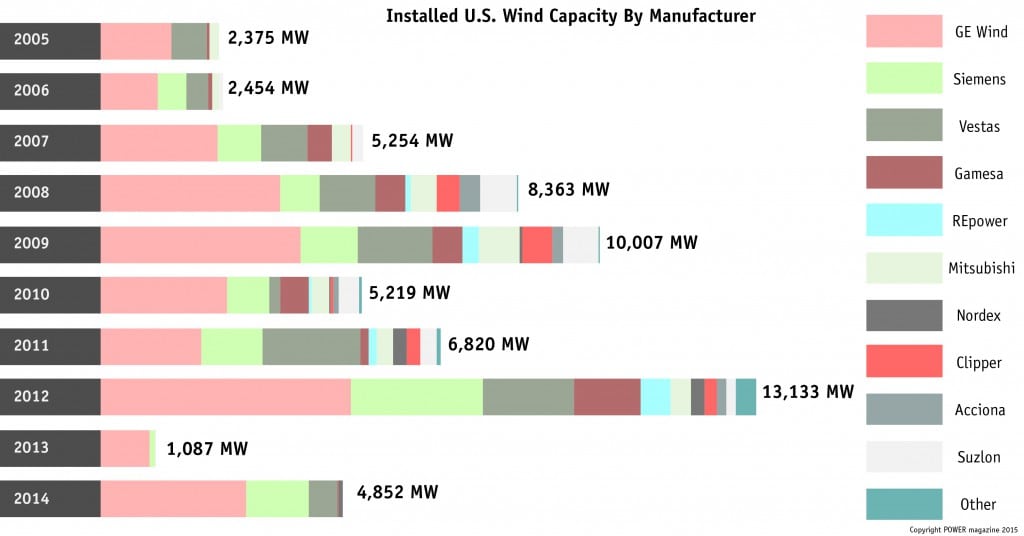
Companies continued to vie for market share in a global context, and the U.S. saw a "notable increase in the number of wind turbine manufacturers serving the U.S. market." GE and Vestas both secured roughly 29% of U.S. market share (by capacity installed) in 2011, followed by Siemens (18%), Suzlon and Mitsubishi (both at 5%), Nordex and Clipper (both at 4%), REpower (3%), and Gamesa (2%). Globally, Chinese turbine makers dominated the market: "Four of the top ten, and seven of the top 15, leading global suppliers of wind turbines in 2011 hail from China. To date, that growth has been based almost entirely on sales to the Chinese market."
Lowered Costs, Technological Leaps
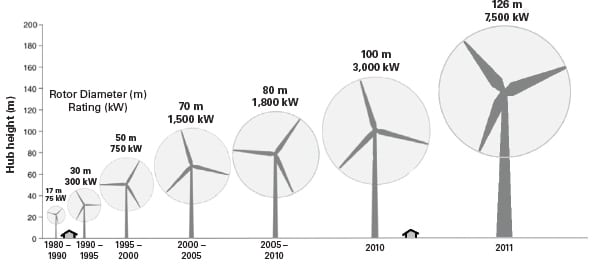
The industry has meanwhile seen several technological leaps over the past years, the report says. The average nameplate capacity of wind turbines installed in the U.S. in 2011 increased to 1.97 MW, up from 1.80 MW in 2010–increasing 174% in size since 1999. Average hub heights and rotor diameters have also scaled with time, to 81 and 89 meters, respectively, in 2011. Since 1998-99, the average turbine hub height has increased by 45%, while the average rotor diameter has increased by 86%. "In large part, these increases have been driven by new turbines designed to serve lower-wind-speed sites," the report says. "Industry expectations as well as new turbine announcements (mostly surrounding additional low-wind-speed turbines) suggest that significant further scaling, especially in average rotor diameter, is anticipated in the near term."
But despite increases in hub heights and rotor diameters, wind turbine prices "dropped substantially" in 2011, ranging between $1,150 and $1,350/kW. This compares with average prices of $1,500/kW in 2008 (prices doubled from roughly $700/kW in 2000). At the same time, wind project capital and maintenance costs continue to decline, driving U.S. manufacturing competitiveness on the global market. For new wind projects deployed last year, the price of wind under long-term power purchase contracts with utilities averaged 40% lower than in 2010 and about 50% lower than in 2009, “making wind competitive with a range of wholesale power prices seen in 2011,” the DOE says. "These price reductions, coupled with improved turbine technology and more-favorable terms for turbine purchasers, should, over time, exert downward pressure on total project costs and wind power prices.”
Uncertainty Ahead
The American Wind Energy Association (AWEA), which has been urging Congress to act on the tax incentives, said last week that nameplate capacity of wind power installations across the U.S. by mid-2012 had exceeded 50 GW. More than 10,000 MW of wind farms were reportedly under construction at the quarter’s end. That constituted "an all-time record,” according to the industry group, with over 100 MW under construction in 21 states, led by Texas, Kansas, California, Oklahoma, and Iowa. "The blistering pace of new construction results from wind farm developers’ racing to finish work before the scheduled Dec. 31 expiration of the PTC, unless Congress acts to extend it," the group said.
AWEA also said the PTC’s looming expiration has "caused the industry’s manufacturing supply chain to already start dramatically slowing down, given the 18-month project development cycle under which the industry operates."
The Recovery Act enabled wind power projects placed in service prior to the end of 2012 to elect a 30% investment tax credit (ITC) in lieu of the production tax credit. Given the relative scarcity of tax equity in the immediate wake of the financial crisis, the Recovery Act also enabled wind power projects to elect a 30% cash grant from the Treasury in lieu of federal tax credits. More than 60% of the new wind capacity installed in 2011 elected the cash grant, the report says, but in order to qualify for the grant, wind power projects must have been under construction by the end of 2011, must apply for a grant by October 1, 2012, and must be placed in service by the end of 2012. “With the PTC, ITC, and bonus depreciation all also currently scheduled to expire at the end of 2012, the wind energy sector is currently facing serious federal policy uncertainty looking to 2013 and beyond,” the report says.
“These truly are the best of times and could be the worst of times for American wind power,” said AWEA CEO Denise Bode. “This month we shattered the 50-gigawatt mark, and we’re on pace for one of our best years ever in terms of megawatts installed. But because of the uncertainty surrounding the extension of the Production Tax Credit, incoming orders are grinding to a halt.”
Sources: POWERnews, DOE, AWEA
—Sonal Patel, Senior Writer (@POWERmagazine)