The International Energy Agency (IEA) deemed growth and disruptions of the world’s power sector so significant to the future of energy, it dedicated—for the first time—a four-chapter “special focus” on electricity in its annual World Energy Outlook (WEO2018). The analysis of world energy trends by the Paris-based autonomous intergovernmental organization is studded with interesting findings. Here are 10 of the most relevant ones.
1. A dramatic global power supply transformation is underway.
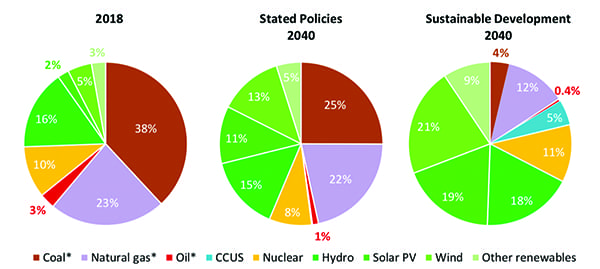
A transformation is “re-defining the nature of electricity supply,” the report notes. While the expansion of renewables has “not yet dented the overall share of fossil fuels,” shares of wind and solar photovoltaics (PV), which now provide 6% of global power generation—up from 0.2% in 2000—could increase to 20% by 2040.
2. Costs for renewables have plunged and seamless integration of variable sources has been achieved.
The IEA noted the global average levelized cost of electricity (LCOE) of solar PV declined 65% over the last five years, and it fell 15% for onshore wind and 25% for offshore wind. The costs of renewable technology vary by region and depend on several factors, including quality of resources, experience of industry, labor costs, availability and cost of land, and licensing and permitting processes. “However, continued technology improvements point to likely cost reductions in the near term,” the agency said. Recent auctions for solar PV, for example, offered record-low prices such as $18/MWh in Saudi Arabia, $20/MWh in Mexico, and $24/MWh in the United Arab Emirates.
Sustained uptake of variable renewable energy (VRE) sources have also prompted changes across electricity systems to accommodate flexibility. The IEA pointed to Denmark, Italy, and Portugal as examples of countries that have recently achieved levels of almost-zero VRE curtailment.
3. New players are providing flexibility.
How energy systems are meeting a growing need for flexibility is “changing rapidly,” the IEA noted. Traditionally, flexibility has come mostly from the power generation fleet, followed by interconnections, and then pumped hydro. But now, “New players such as demand aggregators, virtual power plants, energy service companies and peer-to-peer networks are emerging, blurring traditional supply-demand distinctions between generators, networks, retailers and consumers,” it said.
Power plant flexibility on the global landscape is today provided by natural gas (29%), hydro (28%), and coal (23%, especially in Germany and Denmark), though even less-conventional sources are helping. For example, ramping flexibility has been designed into France’s nuclear fleet, which provides 75% of the country’s power.
Investments and sizes of virtual power plants, which are defined as networks of distributed energy resources, behind-the-meter storage, distributed generation, and demand-side response resources, has also accelerated in recent years. Installed capacity of virtual power plants in Europe was 18 GW in 2017, quadrupling since 2014.
Meanwhile, steep cost reductions of batteries are also beginning to make an impact, though still mostly behind the meter, while digitalization is unlocking smaller, more distributed sources that aid flexibility, especially demand-side response, which now accounts for about 40 GW of total global capacity. By 2040, under the WEO2018’s “New Policies Scenario,” which assumes ambitions expressed by the world’s policymakers are adopted, power plants will remain the cornerstone of flexibility, though interconnections will provide 11% of flexibility, batteries 4%, and demand response 3%.
4. Investment in the sector is mixed.
The IEA noted boldly: “The power sector now attracts more investment than oil and gas combined—a major change for the energy sector, which was traditionally dominated by upstream spending on oil and gas.” However, despite the ongoing transformation in the global power sector, investment in the sector fell 6% to $750 billion in 2017. Coal, which generated about 40% of the world’s power, is slated to see flat growth through 2040, while natural gas, which had a share of almost 23%, is seeing more uptake, as demand for flexible power grows. However, over the last five years, investment in hydropower fell 30% to its lowest level in more than a decade, while investment in nuclear plants also declined to its lowest level in five years (though spending on lifetime extensions for existing facilities rose).
Meanwhile, the IEA noted that recent final investment decisions (FIDs) indicate a further shift away from large dispatchable power plants. Total FIDs for coal plants, for example, fell to a 10-year low in 2017, to about a third of the rate in the previous decade, owing mainly to sharp reductions in China and India. It noted decisions to build gas and hydropower have also slowed in recent years. Total FIDs for gas power fell to 52 GW, or about 30% lower than average in the previous decade, while for hydropower, it was 23% lower than the preceding five-year average (Figure 1).
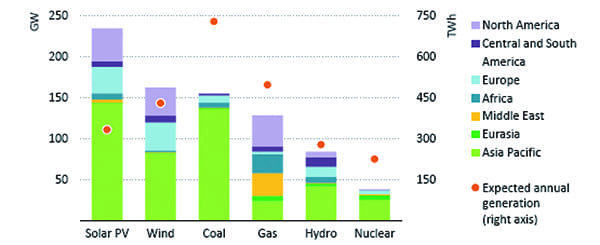 |
| 1. Of the 870 GW that are currently under construction or expected to come online by 2020 worldwide, nearly 60% will be solar photovoltaic, wind power, or hydropower. However, about 300 GW of fossil-fueled power plants are also expected to begin operations by 2020. Courtesy: International Energy Agency (IEA) / World Energy Outlook (WEO2018) |
5. Revenues from wholesale power markets have fallen.
All over the world, meanwhile, revenues from wholesale power sales are shrinking, and new value is being attached to services such as providing flexible capacity. Glaring market conditions with far-reaching implications include that natural gas prices remained relatively low in most markets while international coal prices increased substantially and the cost of renewable energy continued to fall. These factors have especially affected the economics of the nuclear power industry.
6. Global power demand has surged—unevenly.
In 2017, global power demand grew by 3%, reaching 22,200 TWh. Yet, more than one billion people remained without access to electricity, most in sub-Saharan Africa and in developing Asia. Since 2010, the report notes, an average of about 50 million people gained access to electricity every year, compared to an annual average of 35 million between 2000 and 2009.
Growth in power demand hasn’t been even. China’s electricity demand has grown five-fold since 2000, and the nation now accounts for 25% of global power demand, while India’s demand has tripled since 2000. However, demand continues to be relatively stagnant in Japan, the European Union (EU), and the U.S., where the IEA noted the link between gross domestic product growth and electricity demand growth has weakened considerably in the past decade. Electrification of new industries—including for heat and transportation—as well as increased digitalization helped boost demand growth, but it has been outpaced by energy efficiency savings in advanced economies (Figure 2). The IEA also pointed to a shift in consumption as a factor that has contributed to lower demand growth in advanced economies.
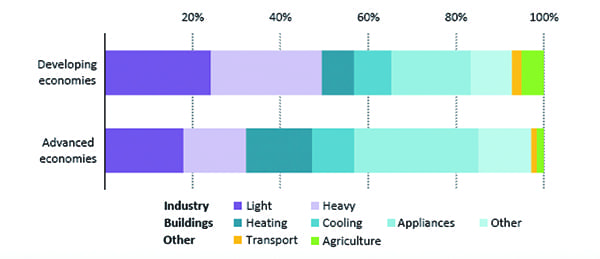 |
| 2. Industry was the largest source of power demand in developing countries, whereas in advanced economies, buildings were the largest source of demand. Courtesy: IEA/WEO2018 |
7. As global power suppliers face market upheaval, ownership is transforming.
Compared to 2003, when 10 of the world’s largest power companies (ranked by installed generation capacity) owned 13% of installed capacity worldwide—and Europe-based utilities dominated the list—in 2017, the top 10 companies owned 18% of total global installed capacity, and the next 15 owned 10%, meaning that the top 25 companies owned about 30% of global installed power capacity. The top four companies are Chinese. Topping the list is China Energy Investment Group, whose portfolio comprised a stunning 230 GW, followed by China Huaneng Group (172 GW); China Huadian Corp. (146 GW); and China Datang Group (138 GW). France’s EDF came in fifth with 129 GW.
The WEO2018 notes that a series of market reforms have altered electricity markets in many regions—with mixed results. While fully regulated markets with vertically integrated utilities tended to face over-investment, leading to excess capacity, market upheaval was apparent in countries that rely on competitive markets (competition drives about 54% of the world’s electricity consumption, it notes). Several jurisdictions—for example, in Colombia, France, and the UK—that rely on markets to attract investment are shifting from markets where energy is the only source of revenue toward the inclusion of a firm or dispatchable capacity product. In the changing business environment, U.S. vertically integrated utilities for the most part kept hybrid generation-retail models, though competitive generators are also moving in that direction.
The trend is mirrored in Europe, where the top-five utilities have been hard hit by stagnant demand, government subsidies, and market overcapacity, and experienced losses of €56 billion over the past five years. The report concludes that as a result of “direct government intervention,” many European markets “ceased to function as competitively as envisaged,” which is why many utilities are investing in more regulated assets and/or energy-as-a-service type offerings.
As notably, new actors are entering the power sector, ranging from software companies to international conglomerates, some who are increasingly investing in retail power and renewables, battery technology, and electric vehicle infrastructure. The WEO2018 dedicates a lengthy discussion to how electricity markets of the future will work, concluding: “It is very likely that over the medium to long term, markets will continue to experience further downward pressure on wholesale energy prices as more zero-cost power generation enters the market alongside new energy service providers and innovative technological solutions.” It urges policymakers and stakeholders to seek new solutions and market designs to support the transition toward low-carbon power markets while ensuring the security and adequacy of power systems.
8. The global power sector is responding to environmental concerns.
The power sector is at the heart of the climate change debate because it accounts for just over 40% of total energy-related CO2 emissions (30% of which come from coal power). But the sector is also still a key source of pollutants—including one-third of total SO2 emissions (40% of which come from developing Asian countries), and to a “limited” extent, NOx and fine particulate matter (PM) emissions.
However, improvements are ongoing. Several countries are actively slashing air pollution through strict control measures, including China and India. Still, by 2040, power generation will increase by 60%, and global power sector emissions of carbon are set to increase by 2% through 2040—half of which will come from developing Asian countries. Emissions of SO2, NOx, and PM from the sector, meanwhile, will fall 50%, 27%, and 38%, respectively.
9. The future points to increased electrification and more disruptions. Under the New Policies Scenario, by 2040, electricity demand will surge 60% (to 35,500 TWh)—twice the rate of overall energy demand. In advanced economies, demand will grow moderately, owing mostly to policies promoting digitization and electrification of heat and mobility.
Under the New Policies Scenario, the stock of electric cars grows by a factor of 100 to about 300 million (or 15% of the total car fleet), though they still only constitute about 3% of global power demand by 2040. However, under the highly optimistic “Future is Electric Scenario”—which assumes widespread electrification will drive up total global demand to 42,000 TWh by 2040—some 950 million cars (or half the total car fleet), 74 million light commercial vehicles, and 15 million heavy-duty vehicles will be electric, and consumption by road transport will triple to 3,400 TWh (about 9% of total global demand).
The New Policies Scenario anticipates motor-driven systems in the industry sector (mostly in Asia) will be a key driver of demand, followed by space-cooling and appliances. Digitization of information and communications technology will also be an emerging source of demand, although energy efficiency gains may temper it.
10. Cost competition by source and technology will ramp up.
Despite its various scenarios, the WEO2018 appears certain that the future of power generation will look different. In 2040, under the New Policies Scenario, variable renewables will take on a 20% share, nuclear 10%, coal 38%, and natural gas 22%. Battery storage will also soar from 4 GW in 2017 to 220 GW in 2040 (and on a more optimistic trajectory, if battery costs fall 70% below where they stand today, 540 GW of batteries could be installed in 2040, making it the main technology for peaking capacity). The dramatic sectoral transformation is partly driven by the emerging competitiveness of renewables and storage technologies.
In the WEO2018, the IEA introduced a value-adjusted LCOE (VALCOE), a new metric for competitiveness of power generation technologies built on an hourly power supply model. The report notes that based on costs and value, wind and solar PV will be among the most competitive sources of new generation in several regions, under a variety of conditions (Figure 3), which will be detrimental to nuclear’s economics. Existing coal-fired plants, however, will remain competitive in China, India, the U.S., and the EU.
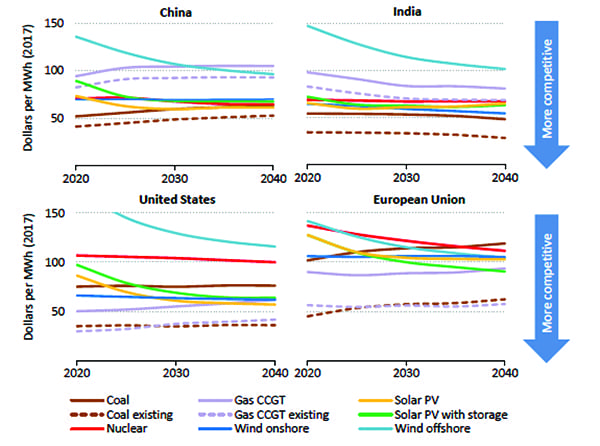 |
| 3. Value-adjusted levelized cost of electricity by technology in selected regions in the IEA’s WEO2018 New Policies Scenario between 2020 and 2040. Coal refers to supercritical coal plants in India, the European Union, and the U.S., and ultrasupercritical coal plants in China. Courtesy: IEA/WEO2018 |
—Sonal Patel is a POWER associate editor.