Design and Care of Reverse Osmosis Systems
Reverse osmosis (RO) systems offer power plant owners and operators a reliable and well-proven water treatment solution. However, designing and caring for an RO system requires a thorough understanding of a plant’s water supply and the technology’s capabilities. The information presented here could help plant engineers design and optimize an RO system to match their needs.
Pure water does not exist in nature; all water in its natural state contains varying amounts of dissolved and suspended matter.
Osmosis is the process in which a solvent, such as water, flows through a semipermeable membrane from a less-concentrated solution to one with a higher concentration. This normal osmotic flow can be reversed (reverse osmosis) by applying hydraulic pressure to the more concentrated (contaminated) solution to produce purified water.
There is no perfect semipermeable membrane. A small amount of dissolved salt is also able to diffuse through, but this results in low concentrations relative to the feedwater values. The benefits of reverse osmosis (RO) technology should be well understood in water treatment for power generation, particularly because of its potential to reduce operating and maintenance expenses. For most sources of water, RO is the least expensive way to remove the majority of dissolved salts.
The term total dissolved solids (TDS) refers to mostly inorganic salts present in solution. The salts exist as cations (mostly calcium, magnesium, sodium, and potassium) and anions (mostly bicarbonate, chloride, sulfate, and nitrate). These positively and negatively charged ions can pass electrical flow, thus determining the conductivity of the water as a measurement of its TDS concentration. Pure water is a poor conductor of electricity.
For plants originally built using only ion exchange, adding RO can reduce chemical regeneration requirements by a factor of 20 or more. Complete removal of regenerable systems might even be considered. With RO upstream removing the bulk of the dissolved salts, the polishing ion exchange systems might be economically replaced with service demineralizer beds that are chemically regenerated by an offsite water service company, or they might be replaced by electrodeionization (EDI). EDI units use electricity to continuously regenerate their ion exchange resins.
Some new and existing plants are now required to remove dissolved salts from wastewater streams prior to discharge. A well-performing RO system can make it possible to re-use the water within the plant. The concentrated salt stream remaining after RO treatment can then be more economically hauled to an area better able to handle it environmentally, or it could be evaporated or discarded in some other manner.
The political and regulatory advantages of becoming a zero-liquid discharge (ZLD) facility can offset part of the capital and operating costs. But the superior economics of RO operation are only achievable if the system and its upstream treatment components are correctly designed, operated, and maintained.
Analysis of a Water Sample
Pulling a water sample for laboratory analysis is a good start in preparing an RO design (Table 1). A comprehensive analysis provides data on the metals in the water, such as iron, manganese, and aluminum; the dissolved salts (cations and anions); the water pH (acidity); and possibly the inorganic total suspended solids (TSS). A measurement of the total organic carbon (TOC) often correlates with the potential for biological activity.
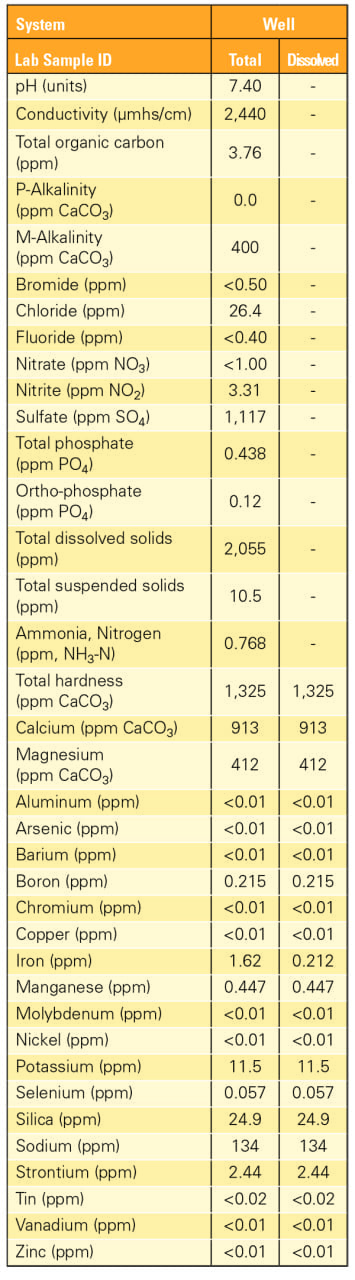 |
| Table 1. Water analysis. This table shows results from an actual water analysis. Results are listed down to the detection limit of the instrument used. Where results fall below these limits, they are reported as less than the detection limit. A dash indicates testing was not requested or was unable to be run. Source: U.S. Water |
A TSS analysis reveals the concentration of filterable solids in the water. The concentration of dissolved metals in the water, such as iron, changes in the sample as they react with oxygen introduced by contact with air. This causes some of the metals to oxidize and become insoluble. The metals that remain suspended may cause the TSS value to increase significantly with many well-water sources.
Biological fouling solids are not well-represented in TSS results. The mass of these solids typically becomes negligible when the TSS filter is dried prior to weighing for results. The water could be tested for its silt density index (SDI) if the metals are first separated out of the sample. This test is highly sensitive to the ability of biological solids to coat and reduce the flow rate through its 0.45-micron test filter. Its results correlate with the fouling tendencies of a membrane system.
No analysis is perfect, and water quality can change over time. Even the characteristics of a well-water source can change if the well is relatively shallow. Sampling methods also affect results; some concentrations can change between sample pull and analysis. Metals may attach to the container’s inner surface. Ammonia and carbon dioxide (CO2) may degas or CO2 may dissolve from exposure to air. Any of these changes will cause the water pH to change. An accurate water pH is best measured on-site.
Chemical suppliers can use a water analysis to predict how much purified water (permeate) the RO might safely separate from the source before the dissolved salts become too concentrated in the remaining water and form scale within the membrane elements (Table 2). The water analysis is also used in designing the RO system, both in projecting the purified water quality and in assessing any effect of the salts on system hydraulics.
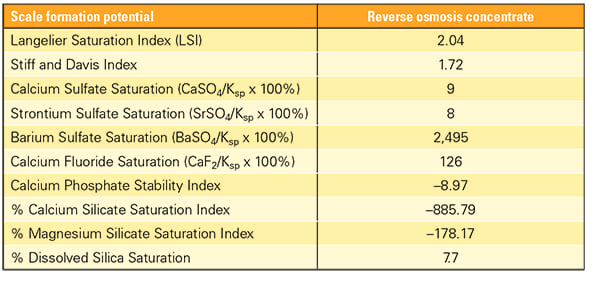 |
| Table 2. Scale formation potential. This table shows partial results generated by a scale inhibitor dosage program for a given reverse osmosis (RO) recovery. The scale inhibitor utilized was USW RO-504 at a dosage rate of 8.42 milligrams per liter (Ksp = solubility product constant). Source: U.S. Water |
Pilot Study for an RO System
An RO system and its pretreatment equipment designed solely on one water analysis may not be fully optimized for the fouling characteristics of the source. It might be oversized or, of greater concern, it might not be ideal for water that has a high membrane-fouling potential. This can best be determined with a pilot study.
A well-designed pilot study uses components that have been scaled down but still offer the same type of media, and use similar flow velocities and exposure times. The pilot RO (Figure 1) should duplicate the permeate recovery, the permeate flux rate (that is, the permeate flow per unit of membrane area), and concentrate stream vessel exit velocities, along with the scale inhibitor dosage and shutdown flush methods.
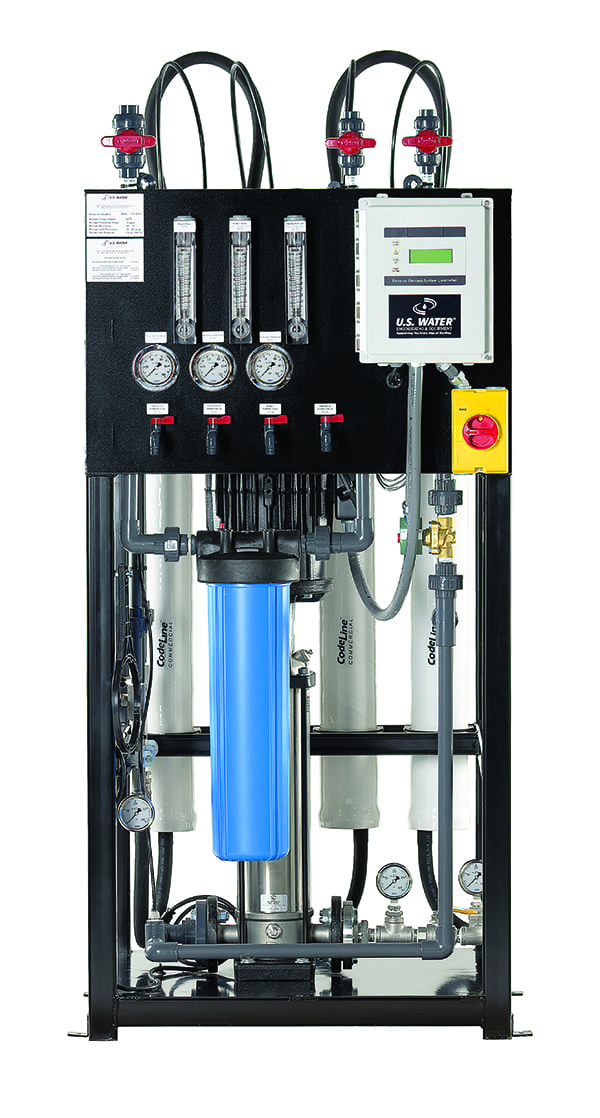 |
| 1. Example of a pilot RO system. The pilot RO system should duplicate the permeate recovery, the permeate flux rate (that is, the permeate flow per unit of membrane area), and concentrate stream vessel exit velocities, along with the scale inhibitor dosage and shutdown flush methods. Courtesy: U.S. Water |
When the pretreatment methods are piloted along with the RO, the system operation can be adjusted to minimize the rate of RO membrane fouling, such as by modifying the permeate flux rate, or the rate at which water passes across the membrane surface and through the membrane elements. With the right equipment choices and sizing, it might be possible to eliminate membrane fouling, which could then dramatically reduce operating costs and maximize membrane life.
The choice of membrane might also be evaluated. With larger systems, demonstrating that a low-fouling membrane element performs better than a standard element helps justify the higher cost. Low-energy elements might be evaluated for their potential to reduce pump sizing and associated power consumption.
The pilot study also offers an opportunity to learn more, specifically about what could foul the RO system. A membrane element from the pilot study might be pulled and autopsied, and analysis of the solids makes it possible to choose cleaning solutions best-suited for removing the fouling materials. The effectiveness of the solutions and cleaning methodology could then be verified with the pilot unit. The longer the pilot system is operated, the more information is gained; a minimum of several months is recommended.
Upstream Equipment
The success of a new RO membrane system is often directly related to its pretreatment. Piloting the upstream processes can be challenging in sizing these components for the pilot’s low flow rate.
The most important role played by pretreatment is protecting the RO from incompatible substances. With the polyamide thin-film RO membrane commonly used today, the biggest concern is removal or destruction of any chlorine, or other potentially oxidative compounds. This membrane has very little tolerance to free chlorine (present in many municipal water sources), and is only slightly tolerant of chloramines (in other municipal water sources).
The most common methods for breaking down chlorine are reducing-agent injection and activated carbon filtration. The most common reducing agent is sodium bisulfite (NaHSO3), which reacts preferentially with free chlorine in breaking it down to the innocuous chloride ion.
Sodium bisulfite/sulfite injection systems can fail in ways that degrade RO membrane elements if not quickly remedied. The day tank could run out of solution, or the injection pump could lose power or pump-head prime. The injection pump setting might provide insufficient chemical to handle the full range of chlorine concentrations, or might be set for such a low pulse speed that the chemical does not sufficiently mix with the feedwater.
The proper NaHSO3 dosage should be injected any time the RO inlet valve opens, even if this opening is for filling the RO or for flushing it out before a shutdown. There should not be significant pipe length distance between the point of injection and the RO inlet valve, because this length will become fully chlorinated during shutdown by chlorine diffusion. The point of NaHSO3 injection should be immediately upstream of the inlet isolation valve.
Activated carbon filtration may offer a more reliable means of breaking down chlorine. During manufacture, non-carbonaceous materials are burned off, leaving porous granules with a high amount of pure carbon surface area. This has a high attraction for adsorbing almost any contaminant, including most organic materials and heavy metals, although there may be limited removal capacity for some contaminants that are shed into the effluent water.
The breakdown of chlorine by activated carbon involves an electrochemical reaction, which offers a high capacity for chlorine removal. The carbon gives up electrons to the chlorine atoms, forming innocuous chloride ions (Cl-) that remain in the water. In this reaction, oxygen atoms previously bonded with the chlorine atoms as hypochlorous acid (HOCl) now attach to the carbon surface. Because the carbon also reacts with dissolved oxygen in the water, the carbon surface can become fully oxygenated. It then loses its ability to remove additional chlorine, but this typically takes a few years with inlet chlorine concentrations less than 1 milligram per liter (mg/L).
When ammonia is present naturally or when added by a municipality, chlorine chemically bonds with the ammonia to form monochloramine (NH2Cl) or possibly dichloramine (NHCl2). The chloramines are not as chemically reactive, and require more carbon volume for their breakdown. A catalyzed carbon media is available at an increased cost that improves the carbon reactivity with chloramines and reduces the need for oversizing the carbon filters.
Carbon system valves must not leak or otherwise bypass. They should be normally closed and driven by sufficient air pressure to prevent chlorinated water from reaching the RO system.
Maintenance is critical to the success of either reducing-agent injection or carbon filtration. It is recommended that the activated carbon media be replaced annually, or based on an increase in the effluent concentration of TOC, to prevent the shedding of biological particles into the RO system.
Over-injection of sulfite causes increased breakdown of dissolved oxygen in the water. This increases the potential for heavy growth of slime-forming species of bacteria, which can quickly foul an RO system if there is a sufficient concentration of organic food in the water source. This potential can be minimized by maintaining a residual sulfite concentration that is greater than zero but less than 2 mg/L as sodium sulfite, measured using a low-level test with sensitivity of 1 mg/L or less. As long as the sulfite concentration is greater than zero and it is well mixed into the feedwater, free chlorine will not be present.
Preventing Scale Formation
There is typically at least one salt in any natural water source that will concentrate beyond its solubility and potentially form scale. Preventing scale formation (Figure 2) should not be a major challenge unless the water source has an unusually high concentration of a slightly soluble salt, or unless the RO is being operated with an unusually high permeate recovery.
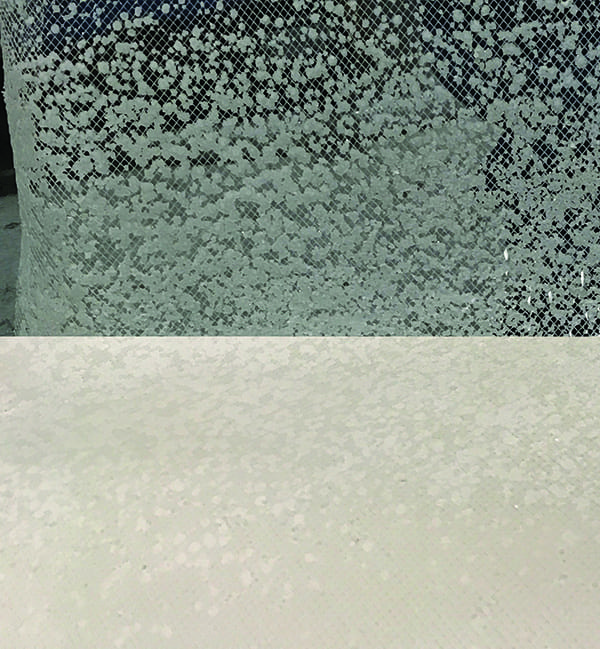 |
| 2. Scale crystals. This image shows scale crystals that formed within the feed-side spacing material (shown at top) and on the membranes (shown at bottom). Courtesy: U.S. Water |
Scale formation may be prevented by injecting an acid into the inlet water, by softening the water, or by injecting a chemical scale inhibitor. Usually the least expensive method is a scale inhibitor, which slows the rate at which salt crystals grow when their solubility is exceeded.
Acid injection prevents calcium carbonate scale formation, but leads to an extremely high concentration of CO2, which is not removed by the RO system and places a high removal demand on downstream ion exchange processes. Also, acid injection alone doesn’t offer much protection against the formation of sulfate or certain other scales.
Softening offers several advantages, but suffers from high capital and operating costs, unless there are particularly low concentrations of calcium and magnesium hardness in the water. The softener also removes other potential scale-forming ions such as strontium and barium, and removes metals that would otherwise foul the RO system, such as iron, manganese, and aluminum. But the softening resin also fouls with the metals and then requires periodic chemical treatment.
Scale-inhibition chemical suppliers often use software programs to estimate the potential for scale formation. These programs predict the concentrations of salts present in the RO concentrate stream, as well as its pH, to determine how much scale inhibition chemical is needed.
The potential for silica scale is common with certain groundwater sources in the western U.S. Inhibition formulations have shown varied success. Maintaining warmer water temperatures improves silica solubility, as does changing the water pH. Increasing pH is a common strategy, although the water must first be softened to prevent hardness scale from forming when a caustic chemical is injected to raise the pH.
When using a scale inhibitor, it is critical to rinse the RO system of its increased concentration of dissolved salts whenever the RO shuts down. Otherwise, scale particles grow and stick to the membrane surfaces during the shutdown. This rinsing process should be automated and is often performed with low-pressure inlet water. Low pressure reduces the RO permeation that tends to concentrate the dissolved salts.
A better rinse might be performed with pressurized permeate water if a line can be plumbed back to the RO from a permeate storage tank system. The permeate is biostatic; its use reduces the formation of biological solids within the RO while shut down.
Membrane Fouling
Fouling doesn’t necessarily reduce RO membrane life if the RO is effectively cleaned. If the RO is allowed to foul too severely and cleaning is not effective, then the membrane will likely continue to lose performance.
It is common to include a filter housing on the RO system inlet that contains 2.5-inch-diameter cartridge filters (Figure 3), whose pore size is nominally rated. The actual ability for removing smaller particles can vary greatly. Some (regardless of rating) only protect the RO against large particles that might get caught within the membrane flow channels or damage the high-pressure pump. These are inexpensive and may last weeks before an elevated pressure drop indicates the need for replacement. Tighter porosity filters that can remove more of the incoming suspended solids are more expensive and also require more frequent replacement. Therefore, the use of these tighter filters becomes more economically viable if the concentration of suspended solids in the water has been minimized by upstream treatment.
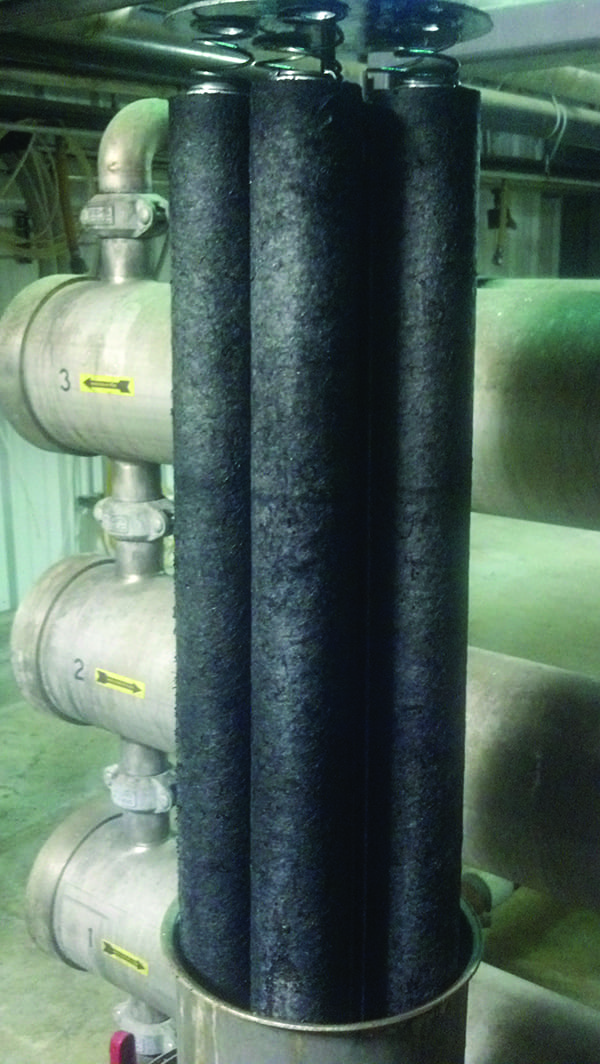 |
| 3. Biologically fouled cartridge filters. It is common to include a filter housing on the RO system inlet that contains 2.5-inch-diameter cartridge filters. The filters shown here are fouled with various particles. Tighter porosity filters that can remove more suspended solids are more expensive, and require more frequent replacement. Courtesy: U.S. Water |
Suspended solids can often be effectively reduced to reasonable concentrations for the downstream RO system with just a multimedia filter. Its inclusion in the RO water system might be sufficient to prevent a high RO fouling rate that could result in unmanageable cleaning requirements. Multimedia filters contain granules of two or more different types or sizes of sand, crushed rock, or anthracite (a hard form of coal). Such a filter can be successful at removing most of the particles that make up the suspended solids if:
- ■ It is sized for a downward flow velocity approaching 2 feet per second.
- ■ It has a lower collection lateral system designed to obtain uniform flow distribution across the media when the filter is operated at low flow velocity, while also allowing the entry of a sufficient backwash flow rate for a 40% bed expansion.
- ■ The filter is backwashed before its previously removed smaller/fine particles are shed, which may occur before there is an appreciable buildup in filter pressure drop.
- ■ After backwashing, the filter is forward-rinsed at its service flow rate until its effluent quality is acceptable (such as based on effluent iron concentration, turbidity, or SDI).
The preceding points do not provide all the filter design requirements, but were chosen because these particular guidelines are often not followed (mostly because they would increase the filter’s cost). Some water sources may contain unusually high concentrations of fine particles. In these cases, it may be necessary to send the water through large reaction tanks intended to give the particles more time to coagulate into larger particles that can then be more easily filtered.
An inorganic chemical coagulant (never a cationic polymer) may be added to the water upstream of the tank to speed the coagulation process. The coagulant is most effective if it is first well-mixed with the suspended solids. If soluble metals (such as iron or manganese) are present in the water source, some percentage will be oxidized by allowing the water to contact atmospheric air in the tank, although this percentage is typically small. A chemical oxidizer such as chlorine (bleach) can be added to the water to oxidize the metals into their insoluble oxides (actually into their hydroxides when present in water) prior to coagulation.
Membrane Filtration
Membrane filtration is becoming more common in various applications, including pretreatment for RO systems. It can often provide water that is more consistently low in its concentration of suspended solids than that provided by a pressurized multimedia filter. Therefore, these systems may be used as an alternative to multimedia filtration, or possibly downstream to further polish the water and minimize RO fouling.
The most common configuration is hollow-fiber technology. Fibers of an inert polymer are extruded with a hollow internal region, or lumen. The fibers may be relatively fine/small in diameter where the inlet water passes around the outside of the fibers, and through the fiber wall to the fiber lumen. It then moves toward one end of the module for collection.
Because the fibers are tightly packed, flow movement around them is not uniform. Feedwater particles will come out of suspension on the membrane surface as the water goes through the fiber. They are not concentrated within a passing stream as the particles mostly would be with spiral-wound RO, so there is no concentrate stream. The systems are simply operated at 100% recovery, except for the water losses from frequent backwashing with filtered water, resulting in an overall recovery of 90% to 95%.
There also are modules with larger fibers that use an inside-out service flow direction. The fatter fibers offer improved membrane surface flow characteristics for better distribution of the fouling solids, while the finer fibers offer the cost advantages of more membrane surface area in the modules.
The membrane filtration systems (Figure 4) should be sized to keep the fiber pressure differential (transmembrane pressure, TMP) relatively low to prevent compaction of solids against the fiber and into the fiber pore structure, and to reduce the potential for fiber breakage. This may mean sizing the fiber for a filtrate flux rate of 30 gallons per square foot per day or less.
 |
| 4. Automated membrane filtration system. The system shown here can be used as an alternative to multimedia filtration, or downstream to further polish the water and minimize RO system fouling. Courtesy: U.S. Water |
The fiber modules are backwashed using the filtrate water at a frequency of roughly once every 30 minutes, again to try to keep the solids from compacting and to prevent particles from getting forced into the pores and subsurface structure. Some manufacturers reduce the backwash volume by knocking the solids free with compressed air.
Backwashing alone may not fully restore the original TMP, and a chemically enhanced backwashing may be required. If this fails to restore original performance, a circulated cleaning for an extended period of time may be needed.
Operation and Monitoring
Large RO systems include a number of membrane pressure vessels, which are staged so that the concentrated salt stream from one set of parallel-plumbed vessels is plumbed into a smaller number of membrane vessels, then possibly plumbed to another stage with an even smaller number of vessels (Figure 5). This staging is based on maintaining flow velocities sufficient to keep suspended particles moving and to assist dissolved salts in diffusing back into the bulk stream from the membrane surface.
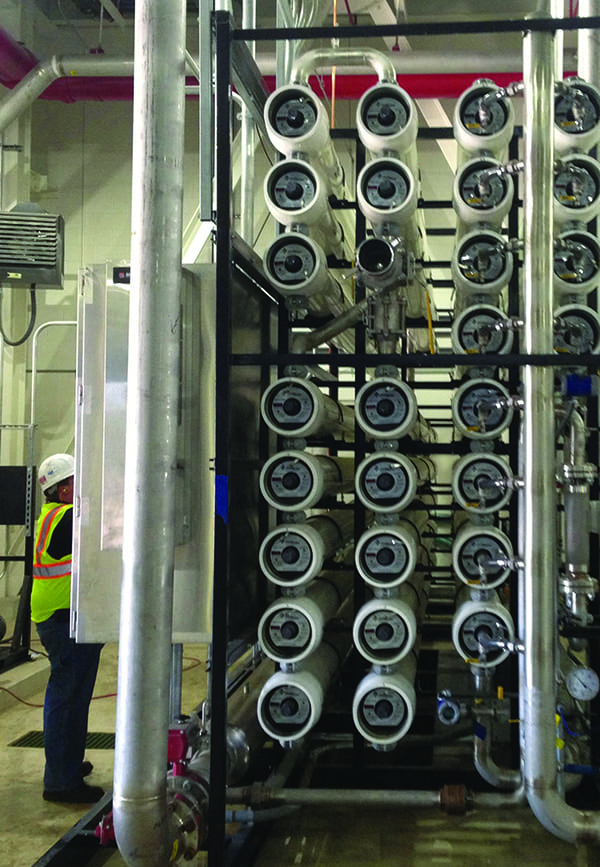 |
| 5. Doubling up. A two-pass RO system purifies the raw water twice, and requires essentially twice the control valves and monitoring instrumentation as a single-pass system. Courtesy: U.S. Water |
RO systems are usually operated by adjusting the membrane feed pressure as needed to achieve the desired RO permeate flow rate. This may be done with a variable frequency drive (VFD) to control the high-pressure pump motor’s rotational speed, or by using a throttle valve located directly downstream of the pump. With VFD control, the adjustment may be automatic. The RO system also has a concentrate stream throttle system to achieve the desired concentrate flow rate. This may be a fixed system that uses an orifice plate, or more commonly a manual or automatic valve.
Along with the permeate and concentrate flow meters, pressure sensors are installed in the system piping to monitor the pressure entering the membrane elements, the concentrate pressure exiting the membrane, and possibly the pressures within the plumbing manifolds that connect the membrane vessel stages. A permeate pressure sensor may be needed, especially if there is significant or variable permeate backpressure on the system.
The electrical conductance of the water streams is used to monitor how well the RO is removing dissolved salts. The RO permeate water conductivity is monitored along with the makeup water conductivity. A percent salt rejection for the system is calculated by subtracting the permeate conductivity from the feed stream conductivity and then dividing this value by the feed conductivity. The salt rejection percentage is probably the most commonly monitored performance variable.
Additional instruments (Figure 6) may be needed if there is variability in the feedwater characteristics, or if a chemical is added. If the water acidity changes naturally or through chemical addition, then the water pH should be continuously monitored. The pH can have a dramatic impact on the RO salt rejection. If chlorine is being removed upstream, an online chlorine monitor or possibly an oxidation-reduction potential (ORP) monitor may be used to warn against its presence.
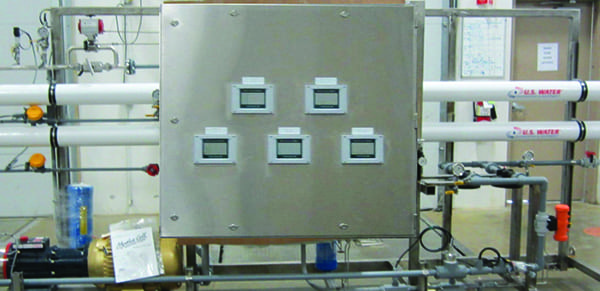 |
| 6. Siting the monitoring instruments. Depending on system location, and its installation configuration, monitoring instruments may be panel-mounted, or mounted directly on system piping. Courtesy: U.S. Water |
Key RO System Variables
Monitoring the percent salt rejection is important, but is limited in its ability to show the state of the RO membrane and is generally not a good gauge of membrane fouling or scale formation.
The relative ability for water to permeate the RO membrane can be tracked (Figure 7) using a variable called the normalized permeate flow rate, which is the RO permeate flow rate standardized for the effects of operating pressures, dissolved salt content, and water temperature. The feed-to-concentrate pressure drop tracks the resistance to water passage through the flow channels of the various membrane elements. This value may be calculated for the entire RO vessel array, or if inter-stage pressures are available, it can be calculated for the individual vessel stages. If flow rates are not kept constant when operating the RO, it is necessary to standardize the pressure drop for the effect of changing flow rates in calculating normalized pressure drop values. This then allows direct comparison of these values over time regardless of whether any flow rates have changed.
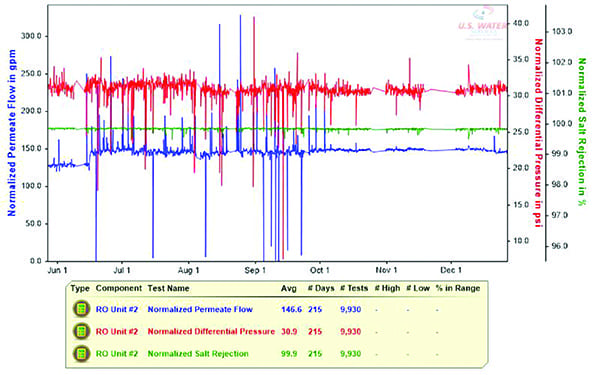 |
| 7. A stable RO system. This graphic shows the performance variables of a stable RO system, with normalized permeate flow, and normalized differential pressure in psi, over a 215-day period. Courtesy: U.S. Water |
Small suspended particles or salt particles that coat the RO membrane surface can cause the RO normalized permeate flow rate to decline (Figure 8). Larger particles that get caught within the membrane flow channels and subsequently block the flow will cause the normalized pressure drop to increase.
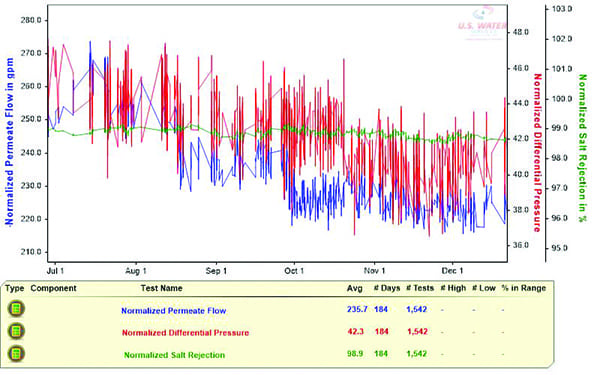 |
| 8. Declining normalized permeate flow rate. This chart provides information about an RO system with a declining normalized permeate flow rate, as tracked over 194 days. Courtesy: U.S. Water |
If something in the water is chemically reacting with the RO membrane, the effect will likely be apparent in the normalized permeate flow rate, and possibly in the salt rejection. For example, if chlorine is allowed to come into contact with the RO membrane, the extent of membrane oxidation is apparent as an increase in the normalized permeate flow rate, soon followed by a decline in RO salt rejection.
A thorough understanding of the state of the RO system can be gained by routinely calculating and graphing the salt rejection and the two normalized performance variables, though their values may be misleading if any of the instrument readings are inaccurate. It is critical that monitoring instruments be routinely calibrated and repaired/replaced if in error.
Frequency of System Cleaning
Chemical cleaning is a routine requirement for most RO systems; the frequency depends on the effectiveness of the pretreatment equipment. As fouling solids or scale particles accumulate, their characteristics often change and they become more resistant to cleaning. Clay and biological materials tend to compress against the membrane surface and become chemically resistant as water is squeezed out of their structure. Scale formations may change from being primarily calcium carbonate (relatively easy to clean) to calcium sulfate (difficult to clean).
The change in normalized RO performance variables can be used to determine cleaning needs. Most membrane manufacturers recommend cleaning before these variables change by about 15%.
Certain types of fouling solids or scaling salts may have a substantial impact on permeate quality. Aluminum salts may come out of suspension as a fouling particle, only to re-dissolve if the water acidity changes. This can result in increased aluminum passage from the membrane surface through the membrane and into the permeate/purified water. Calcium carbonate scale may leach a relatively high concentration of calcium carbonate through the membrane into the permeate stream and affect the conductivity. Most other fouling solids don’t have a significant impact on RO salt rejection unless the fouling is extreme.
How to Clean a System Membrane
Membrane cleaning involves passing a cleaning solution through the membrane system at conditions that promote the dissolution or delamination of the fouling solids from the membrane surface, or from the spacing material along the membrane flow channels. The optimum solution depends on the particular fouling solids or scale particles, and the relative ability to clean is often limited by membrane chemical tolerance.
Most strong oxidizing agents that are typically effective in cleaning biological solids are not compatible with RO membranes. There are also limits to the pH extremes that should be used. In addition, while higher temperatures increase the rate of cleaning, the solution temperature is limited to less than 105F or as designated by the membrane manufacturer.
The most critical characteristic of a cleaning solution is its pH. Acidic solutions are more effective in dissolving metals and scale formations, while alkaline (high pH) solutions are more effective in removing clay, silt, biological, and other organic solids. Strongly acidic solutions may stabilize biological solids and should not be used as a first cleaning step. Finishing a cleaning with a strongly acidic solution tends to leave the membrane with increased rejection characteristics but reduced permeate flow, while finishing with a strongly alkaline solution has the opposite effect.
The addition of specific cleaning agents often improves the solution’s cleaning abilities. A chelating agent assists in extracting metals from the fouling solids, while surfactants/detergents improve the solution’s ability to penetrate the fouling solids and suspend oily substances. The use of surfactants may reduce cleaning time, but increases the time required for rinse-up.
When the fouling solids cause a flow restriction, increasing normalized pressure drop, high cleaning flow rates (within the membrane manufacturer’s guidelines) through the membrane feed channels cause agitation that assists in breaking up the deposits. When the solids coat the membrane surface and reduce the normalized permeate flow rate, the delamination of these solids is best achieved by cleaning at low pressure, so that water does not permeate through the membrane during the cleaning process, creating a force that holds the solids to the surface.
Achieving a high cleaning flow rate that is balanced throughout all the membrane vessels usually requires each vessel stage to be cleaned separately. This also helps minimize the pressure required to push the solution through the elements. Cleaning solution should be pumped at high flow rates, as recommended by the membrane manufacturer, and pumped at the maximum pressure required to achieve the target flow rate—but this may be limited to 60 psi to reduce the potential for crushing or otherwise damaging the membrane elements.
The solution is directed in the normal feed-end direction of flow and the exiting concentrate stream is then returned to the cleaning tank at minimal backpressure. The flow direction may occasionally be reversed so that the solution enters the concentrate end of the stage when fouling solids are blinding the face of the lead-end membrane elements.
There may be a small flow of permeate that should also be returned to the cleaning tank using a separate line. In spite of its low apparent flow rate, the permeate should never be valved off because this may put certain membrane elements at risk of physical damage.
Data should be recorded during the cleaning process. With membrane surface fouling, it is difficult to gauge when original performance has been restored until the unit is rinsed and operated normally. If the fouling solids were causing an increased pressure drop in the RO, then the cleaning inlet pressure can be used as a measure of cleaning progress. If the pressure keeps declining, the cleaning is still removing fouling solids. If the fouling is severe, it may require a number of hours of circulation before the inlet pressure stabilizes.
Cleaning success is confirmed when the normalized pressure drop, and normalized permeate flow rate, return to their startup values. ■
—Wes Byrne is a membrane technologies consultant for U.S. Water.