Curbing the blue plume: SO3 formation and mitigation
Recent, widespread additions of scrubbers and selective catalytic reduction (SCR) systems at U.S. coal-fired power plants have significantly reduced concentrations of the pollutants SO2 and NOx in America’s air. But in some instances, the chemical processes in the downstream equipment have produced unexpected side effects. One is increased emissions of SO3 and a resulting increase in the opacity of stack emissions (stack opacity)—a phenomenon sometimes called the “blue plume.”
One of the first reported appearances of the blue plume was at American Electric Power’s (AEP’s) 2,600-MW General Gavin Plant following the installation of SCR units there in 2000 (Figure 1). For Gavin, an acceptable solution was found only after a series of expensive, lengthy tests of different control technologies.
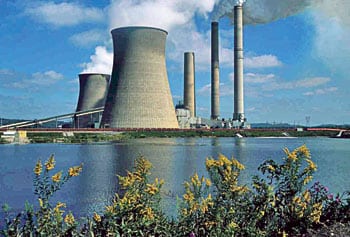
1. Unintended consequences. AEP’s General Gavin Plant battled the “blue plume” shortly after it installed SCR units. Injecting trona (the raw material for soda ash) has brought SO3 emissions under control. Courtesy: American Electric Power
Any attempt to mitigate blue plumes requires an understanding of the relationship between SO3 and stack opacity. The plume from a power plant stack becomes opaque when SO3 is converted into vapor-phase sulfuric acid (H2SO4). When the H2SO4 cools, it forms fine particles of sulfuric acid aerosol. In sufficient concentration, the particulates scatter light and create a visible plume that is typically blue or brown-orange.
The plume’s color and opacity depend on the aerosol concentration, aerosol size, sun angle, gas temperature, and atmospheric conditions. In most cases, a plume is visible when H2SO4 aerosol concentrations in the flue gas exceed 10 to 20 ppm. The higher the plume concentration, the greater the discoloration and the longer the plume remains in the atmosphere. Under severe conditions, the sulfuric acid–containing plume may even reach ground levels.
Sources and sinks
Of the factors affecting plume opacity, only SO3 concentration can be controlled by a power plant. SO3 formation and concentrations depend on several variables that differ significantly from plant to plant, making predictions difficult. Because the variables reflect differences in fuel composition, component design, and plant operation, there is no one-size-fits-all solution to the problem.
SO3 production within a coal-fired plant is affected by several plant systems, such as the furnace, the SCR system, the air preheater (APH), the electrostatic precipitator (ESP), and the wet flue gas desulfurization (FGD) unit (scrubber). Differences within a plant are a result of different chemical reactions that form SO3 during combustion and flue gas conditioning.
The scientific community has a reasonably good understanding of SO3 formation mechanisms and how the compound behaves in downstream emissions control devices. Because there are as many gas path configurations as there are plants, your mileage may vary. Follow the gas path in Figure 2 to realize how each component influences SO3 levels.
2. Creeping regulations. The Gavin plant’s complement of emissions control systems has evolved over the past 35 years. Source: American Electric Power
2a. Gavin was built in the 1970s as a pulverized coal unit. The original construction cost was $660 million (1975 $) or $1.7 billion (1999 $).
2b. Gavin modifications to comply with 1990 Clean Air Act Amendments. The cost of the SO2 scrubber was $616 million in 1995 when it was installed. Low-NOx burners were installed in 1999.

2c. Gavin today—after complying with NOx SIP Call in 2001, and adding chemical injection for SO3 control. The cost of SCR NOx control was $195 million.
SO3 from the furnace. Inside the furnace, some SO2 (a normal by-product of the combustion of any sulfur-containing fuel) is converted to SO3 through reactions with atomic oxygen (O), molecular oxygen (O2), and catalytic reactions with tube deposits (and local oxygen). The extent of the conversion depends on the fuel’s composition, the flue gas temperature, the oxygen concentration (excess air) in the furnace, and the ash content of tube deposits. The conversion of SO2 to SO3 takes place in the furnace’s radiant section and backpass at a rate of about 1%. In other words, a typical furnace whose flue gas contains 2,000 ppm of SO2 also would have about 20 ppm of SO3 in the flue gas leaving the economizer.
SO3 from the SCR. The vanadia-based catalysts that SCR systems use to reduce NOx also oxidize SO2 to SO3. The extent of conversion depends on the type of catalyst and on flue gas temperature, with higher temperatures producing more SO3. Conversion levels are generally 0.5% to 1.5%, so our typical furnace with 2,000 ppm of SO2 in its flue gas would have another 20 ppm of SO3 added to the flue gas at the SCR outlet (Figure 3).
3. Chemical factory. The chemical reactions occurring in a selective catalytic reduction system. Source: American Electric Power
SO3 reduction by air preheaters. In contrast to SCR systems, air preheaters reduce SO3 levels. Although the extent of reduction varies greatly from unit to unit, it generally depends on the flue gas temperature and the type of heater (whether it is regenerative or tubular). The faster the temperature quench and the lower the air preheater outlet temperature, the greater the SO3 reduction. Reduction rates of 10% to 50% are typical. This reduction, however, is tempered by the increased risk of H2SO4 formation at lower (<500F) outlet temperatures. At lower temperatures SO3 also can combine with ammonia slip from SCR or selective noncatalytic reduction (SNCR) systems to form ammonia bisulfate, which can deposit on heater surfaces and cause plugging and increased pressure drop.
SO3 reduction by electrostatic precipitators. ESPs also can reduce SO3 levels. The extent of reduction primarily depends on the flue gas temperature and the composition of the flyash. Large SO3 reductions that transfer a significant amount of SO3 to the flyash may reduce an ESP unit’s capture efficiency. Here, too, reductions typically range from 10% to 50%.
SO3 reduction by wet scrubbers. SO3 levels are reduced by wet FGD systems. The compound typically is converted to H2SO4 mist (vapor-phase sulfuric acid) because the temperatures in an FGD unit are below the H2SO4 dewpoint. The extent of reduction depends on characteristics of the wet scrubber’s design, in particular its temperature profile. Reduction is generally in the 30% to 40% range. Because scrubbers are not good at removing H2SO4 aerosols, most of the SO3 converted to H2SO4 in the unit will exit the stack. It should be noted that it is very hard to differentiate between SO3 and H2SO4 in stack measurements; in fact, the two quantities often are used interchangeably.
Three steps to a strategy
Armed with this understanding of the basic chemistry of SO3 formation and behavior in coal-fired plants, owners and operators can take a three-step approach to planning an appropriate SO3 control strategy.
Step 1 is understanding SO3 behavior in the context of existing plant design and operating conditions. Targeted testing may be needed to determine how much SO3 is actually being added or removed by downstream systems, as described in the previous section. Planners would be wise to check the consistency of this targeted data against the contents of the plant’s information historian.
Step 2 is assessing the impact that proposed changes in plant equipment and operation would have on SO3 levels. This entails developing—at a minimum—a “most-likely profile” of SO3 behavior based on projected plant conditions and experience at similarly configured plants. To increase the chances of arriving at an optimal strategy, consider using analysis tools such as process or computational fluid dynamics (CFD) models to develop multiple scenarios and profiles.
Step 3 is choosing from among available SO3 control technologies. Options include changing to a lower-conversion SCR catalyst and/or sorbent injection after the SCR. Common sorbents used are hydrated lime, a magnesium-hydroxide slurry, sodium bisulfite (the solution selected by Cinergy’s Gibson Station), or Trona (sodium sesquircarbonate)—the choice at General Gavin Station. CFD modeling (Figure 4) can compare the performance risks of the different control options to help inform decision-making. For example, CFD modeling of the lower and upper furnace under different load conditions can simulate slurry injection performance and provide conceptual design considerations for SO3 control technologies. Specific design and operating considerations such as injector locations and slurry flow rates can be modeled and designed in advance.
4. Predictive tools. A computational fluid dynamics model of slurry droplet injection in an upper furnace. Source: Reaction Engineering International
Final considerations
If a plant is considering installing or upgrading an ESP unit, planners also should attempt to predict the impact of that change on SO3 levels. Assessments should seek to:
- Estimate the performance and reliability of wet-ESP technologies.
- Determine the impact of switching from a hot-side ESP to a cold-side ESP on the plant’s SCR system.
- Evaluate the use of a wet-ESP for controlling mercury and PM2.5 emissions (as opposed to use of a dry ESP plus another SO3 control technology).
Once technical assessments have identified one or more SO3 control technology options appropriate for a given plant, the next step is to determine the extent to which the options comply with current regulations (EPA Method 9). Following this regulatory assessment, an economic and commercial feasibility assessment can be performed to quantify and compare and contrast the options’ lifecycle costs under different projected load and operating conditions.