Computer Simulation of HRSGs Can Improve O&M
Obtaining accurate data about the performance of a plant’s heat-recovery steam generator is crucial to ensuring the smooth operation and maintenance of the equipment. Software designed to model and simulate HRSG operations can provide valuable information about corrosion and other operational problems.
Power plant staff need reliable information on process conditions in their heat-recovery steam generators (HRSG) to ensure the equipment’s dependable operation and optimum performance. Current and historical operating data from the distributed control system (DCS) can be used to determine the root cause of failures or to predict the degree of wear from a variety of mechanisms. These include flow-accelerated corrosion (FAC), corrosion fatigue, and creep and fouling of the cold-end tubes. Unfortunately, data available from a DCS are at times insufficient for in-depth analysis because they do not provide a complete picture of process conditions in the region of interest. This may be due to insufficient online instrumentation, scanning rates that are too low, or limitations on the tags stored in the DCS history database.
Software Simulations Support HRSG Analysis
The modeling and simulation of HRSG operation in software is a way of overcoming the difficulties related to insufficient DCS data. If such simulation yields accurate predictions of the process conditions at any point in the HRSG, it can complement or validate information available from the DCS for root cause and unit life assessments. In addition, it permits the prediction of HRSG performance with any given set of operating conditions. This is useful for generating "what-if" scenarios, as a desktop simulator to train operations staff, or for checking the impact of design modifications and repairs.
This article presents the results of simulations performed with boiler-modeling software to support the analysis of actual HRSG operating issues at a number of power plants.
For maximum value, modeling and simulation software should have certain essential features:
-
Accurate modeling of single- and two-phase flow regions in both natural and forced circulation regimes with pressure drops and fluid velocities calculated at the component level.
-
Capabilities for dividing heat exchanger elements into zones and gas/water/steam flow into separate streams to better calculate temperature and mass flow distributions.
-
Predictions of tube and fin metal temperatures in all heat transfer regimes.
-
Heat transfer algorithms that include the effect of thermal radiation from gases on boiler components with component thermal conductivities that are material- and temperature-dependent. This is extremely important for assessing accurate heat loads on tube panels downstream of duct burners.
-
Dynamic simulation capability to permit the evaluation of process conditions during transients such as start-ups, shutdowns, or system upsets.
Modeling the HRSG
The first step in doing a simulation of HRSG operation is to build a software model using the mechanical design data for the unit in question. The level of detail and type of analysis will drive the complexity of the HRSG model. Of particular importance is determining if the simulation is to be a steady-state or dynamic one.
Components in the surrounding balance of plant are incorporated when needed for the particular application. Typically, these consist of vessels, pumps, and the steam turbine. Other systems that are tied to the steam cycle, such as gas turbine (GT) coolers and auxiliary boilers, can be added as well. The GT is modeled as a heat source with mass flows, temperatures, and gas composition derived from the original equipment manufacturer’s (OEM) performance data. Proportional integral derivative control elements are added to provide automated control of boiler elements such as valves, attemperator sprays, and duct burner fuel flow for a dynamic simulation.
To simplify the modeling process, the gas-side (Figure 1) and water-side (Figure 2) streams are laid out separately while sharing the same components. Initially, the model is constructed using OEM design data. Running this "clean" model should yield results that closely match those specified in the OEM design cases. The "clean" model can then be adapted to investigate various operations and maintenance (O&M) issues, as shown in the following examples taken from recent projects at a number of power plants.
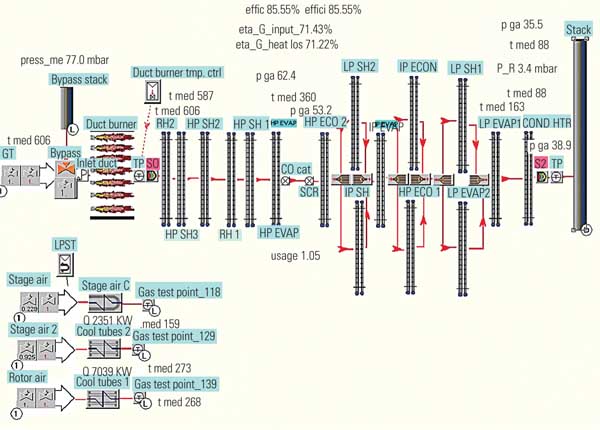
1. Triple play. This is an example of a gas path model for triple-pressure reheat HRSG. Courtesy: Tetra Engineering Europe
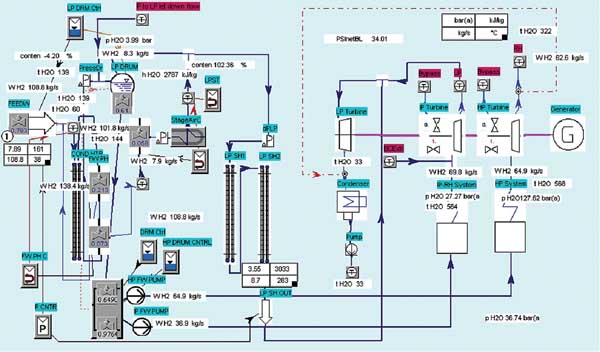
2. Following the flow. This is an example of a water path model for triple-pressure reheat HRSG. Courtesy: Tetra Engineering Europe
Evaluating the Potential for HRSG Cold-End Deposition
Cold-end deposits in the HRSG are a major problem at many plants. They typically comprise corrosion products from the reaction of sulphuric acid with iron on boiler surfaces. The sulphuric acid is created by the reaction of sulphur trioxide (SO3), which is created by burning fuels with traces of sulphur, with moisture in the exhaust gas.
The acid will react to corrode the iron in HRSG components if it condenses on their surfaces and forms deposits of iron oxides and iron-sulfur compounds. Therefore, the objective is to keep the metal temperature of the heat transfer surfaces above the acid dew point. Tubes containing water and/or steam at saturation will have an external metal temperature that will be very close to the inside fluid temperature.
Any deposits will accumulate and clog the finned HRSG heat exchanger tubes. This occurs at the back or "cold" end of the unit, toward the exhaust stack, because that is where the metal temperatures can be low enough to drop below the sulphuric acid dew point. If the plant has a selective catalytic reduction system for NOx control, then deposits of ammonium bisulphate may also be present at the cold end, worsening the fouling problem.
Predicting the absolute rate of deposition is difficult because of numerous uncertainties. These include the amount of sulfur present in the exhaust gas and, more importantly, how much of the sulfur is converted to SO3. Nevertheless, by accurately calculating the metal temperatures on heat exchanger surfaces throughout the HRSG, a relative risk of deposition can be identified and the impact of potential solutions investigated.
A software model of the HRSG was developed and used to predict the cold end tube wall and fin temperatures and investigate the effect on plant performance of raising the cold-end temperature by recirculating inlet feedwater.
Figure 3 shows the cold-end portion of the heat-energy-temperature (QT) diagram from the simulation run with the GT outlet (HRSG inlet) conditions corresponding to the OEM full-load base design case. The green dotted lines show the probable range (160F to 190F) for the sulphuric acid dew point, which is calculated using typical values for fuel gas sulfur and exhaust moisture content.
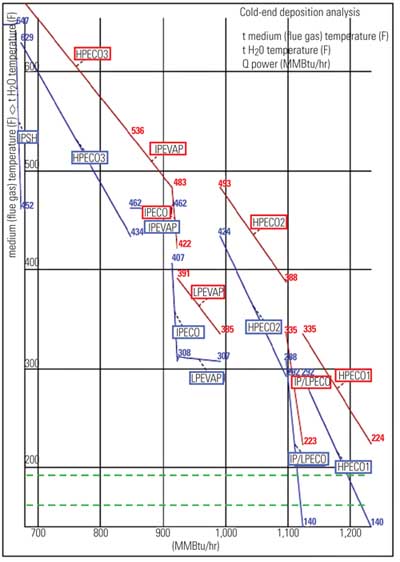
3. Chilly forecast. The boiler simulation run predicts the cold-end temperature profile. The calculated most-probable range of acid dew point is shown by the green dotted lines. Courtesy: Tetra Engineering Europe
Clearly, the last sections of the high-pressure economizer 1 (HPECO1) and the split intermediate-pressure/low-pressure (IP/LP) economizers are below the temperatures where acid may potentially condense on the tubes. These modules, each comprising seven rows, are located in parallel in the gas path and therefore have the same temperature profiles.
The fluid temperature predicted by the model at the entrance to each row of IP/LP economizer tubes is shown in Table 1. From this data it appears that only row 1 and possibly part of row 2 are at risk for deposition.
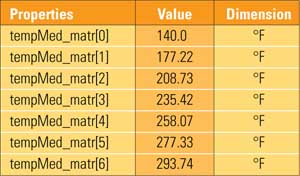
Table 1. The acid test. Simulations are performed to determine if the fluid temperatures are such are that acid may potentially condense on the tubes. Inlet water temperatures to rows 1 through 7 of IP/LP economizer are shown. The first value is for row 1 nearest the HRSG exhaust stack. Courtesy: Tetra Engineering
Europe
The temperature profile in a tube row can be obtained from the boiler simulation. It shows that only the lower half of the tube is susceptible to cold-end deposition.
As mentioned above, the metal temperatures in the tube are assumed to be identical to fluid temperatures. This can be verified and the zones that are at risk for deposition further refined. Table 2 shows the tube average temperature profile from the inside wall (which is essentially at the fluid temperature) to the fin tip. The temperature difference is just under 25F. A similar difference is found in the other tube rows. It has been shown that acid condensation in environments with few particulates (such as in HRSGs fired with natural gas) will be small at temperatures that are just within a few degrees of the dew point. This observation would imply that much of the surface area of row 2 would not be at risk of deposition.
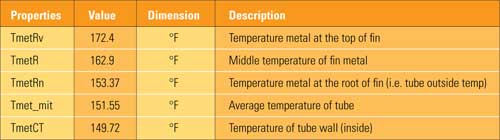
Table 2. Looking for trouble. This is the averaged tube temperature profile for row 1 of the IP/LP economizer. Comparing the metal temperatures with the fluid temperatures can reveal potential risk for deposition. Courtesy: Tetra Engineering Europe
A recent visual inspection confirmed that only the last row, and in particular the lower sections of the last row, had significant deposits.
The next step was to investigate the effect of adding a recirculation loop to the feedwater inlet. This would allow the raising of the inlet water temperature to above the sulphuric acid dew point, thereby potentially reducing the amount of cold-end deposition.
The HRSG model was modified to add separate recirculation loops for the HP economizer and IP/LP economizer. In the actual plant this would represent a significant capital cost, requiring the installation of two pumps, two 3-way valves, connecting piping, and additional instrumentation and control.
The control loop was set to raise the feedwater temperature to 194F (90C). This could be considered the minimum that would raise tube metal temperatures above the estimated maximum dew point over all of the heat exchanger surfaces.
The result was a reduction of the HRSG input-to-output efficiency from 87.19% to 86.12%. This translates into roughly a 1% loss in steam turbine output. Changing the recirculation temperature setting to 176F (80C) reduced the efficiency drop to 0.67%, although this is still significant.
Fouling from deposits will also lead to increased backpressure on the GT and a loss of heat transfer on the tubes. The analyzed HRSG has economizer tubes with a relatively high fin pitch (286 fins/m or 7.26 fins/in.). This renders the unit more susceptible to backpressure problems if any deposits form. Backpressure changes can be tracked and trended by logging the measured gas pressure drop across the HRSG with operating conditions normalized to equivalent mass flows.
The heat absorbed in the last few economizer rows is small, and deposition in these areas has little effect on performance. This hypothesis was tested with the boiler model by simulating the fouling of all seven rows of the IP/LP and HP economizers. A fouling factor of 5% in heat transfer efficiency was first applied, implying very heavy fouling. The result was a 0.15% reduction in efficiency. A more realistic fouling factor, again applied over all seven economizer tube rows, caused a 0.05% drop in efficiency. As fouling currently is occurring only across the last one or two rows, these modeling results imply that the actual efficiency losses from reduced heat transfer are negligible.
Using Modeling to Assess FAC Risk in an HRSG
Flow accelerated corrosion is a highly localized corrosion process that will thin the walls of carbon steel piping that carries water or a two-phase mixture of water and steam in power plant environments. Though the process is gradual, it can result in a pipe rupture if left unchecked.
Industry research has determined that five factors can influence the rate of FAC in a boiler pipe or tube: material composition, fluid temperature, pH, oxygen concentration, and local fluid velocity. Various semi-empirical methods have been developed that use these factors to predict relative wear.
The first four factors can be determined from the design or by direct measurement. The local fluid velocity can be calculated using computational fluid dynamics, yet this factor typically is accounted for by combining the bulk fluid velocity with a "geometry factor" for the pipe section under consideration. FAC can also occur in certain HRSG sections such as the LP evaporator with two-phase mixtures because the velocity of the water component may be very high. Therefore the steam fraction must be taken into account in any analysis.
A boiler model was used to support the FAC risk assessment at a combined-cycle plant with two identical HRSG units. The plant operates in base load with daily operation of the duct burners to augment power production during peak times. The assessment results were in turn used to generate an inspection plan that identified high-risk locations. The assessment used a spreadsheet that listed all the flow circuits.
Bulk flow velocities and temperatures are among the required inputs. These were calculated using steady-state, full-load simulation runs for both fired and unfired conditions.
The results showed that the LP evaporator had a very high circulation ratio in both fired and unfired modes. Therefore, the fluid velocities in the LP evaporator downcomer and inlet and outlet feeders were relatively high. When the appropriate geometry factors were applied to estimate local fluid velocities, the lower feeder pipes to the LP evaporator headers were shown to have the highest risk.
Previous inspections had shown heavy wear at the vortex breaker in the LP drum above the downcomer pipe, which is consistent with excessive flow velocities. Unfortunately, before the inspection plan was implemented, several failures were found at the branches from the downcomer to the lower inlet feeder pipes, in the area predicted to have the highest risk. The unfailed branches all showed considerable thinning. The plant plans to solve the problem by replacing the at-risk sections with a material that is more resistant to FAC (T11 steel with higher chrome content).
Using Simulations to Evaluate HRSG Stress from Thermal Expansion
The effect of thermal expansion on operating stresses is a critical factor for assessing the impact of cycling operation on HRSG components. High cyclic stresses can lead to fatigue failures in HRSG components after a relatively small number of starts.
The high-temperature tube bundles at one plant were considered to be at risk from thermal stresses. The tubes at different temperatures entering a single header will tend to expand by a different amount. This differential thermal expansion will raise stresses at the tube to header joints. Simulations with the boiler software can be used to generate temperature profiles as inputs to a finite-element analysis (FEA) that will calculate peak stresses in components. For the primary superheater, the following average temperatures were calculated for tube rows 1 to 3 (coolest to hottest) at full design load:
-
Row 1: T12 651F (344C)
-
Row 2: T22 774F (412C)
-
Row 3: T22 788F (420C)
Figure 4 shows the three rows (row 1 at left) and the calculated displacements. Rows 2 and 3 are expanding farther downward, causing a theoretically uneven displacement. This will produce a crack opening stress, as shown in Figure 5. The stressed region starts in the weld between the header and the tube and stretches up to the middle of the bend in the tube.
Combined thermal performance and FEA simulations on the other HRSG modules showed that there were several more high-stress areas caused by temperature differences across the tube rows.
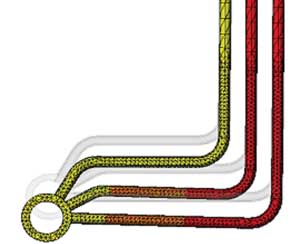
4. Checking for fatigue failures. Displacement of SH1 tubes at lower header. Courtesy: Tetra Engineering Europe
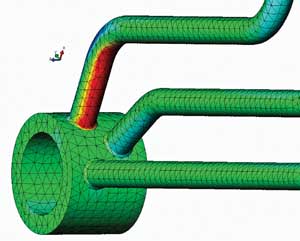
5. All stressed out. An area of high stress on row 1 tube-to-header junction. Courtesy: Tetra Engineering Europe
Simulating the Dynamic Response of Once-Through HRSG
A dynamic simulation is useful for analyzing the effect of various operating transients on process conditions. In a once-through HRSG (OT HRSG), the dynamic response to changes in input conditions is a critical consideration. Because of their small water inventory, any change in heat input will immediately affect the system.
Many other OT HRSG units are used to generate saturated steam for enhanced oil recovery operations. A key consideration in these units is that the steam fraction does not exceed about 80% to avoid dryout and excessive deposition of contaminants on the boiler tube walls.
Figure 6 shows the output from a simulation for an OT HRSG where the duct burner is shut down and then restarted. The outlet steam fraction is set to 80% by controlling feedwater inlet flow. Shutoff of the duct burner has a significant effect on steam production, but the other parameters — final evaporator fin tip temperature and entering steam fraction — are stable.
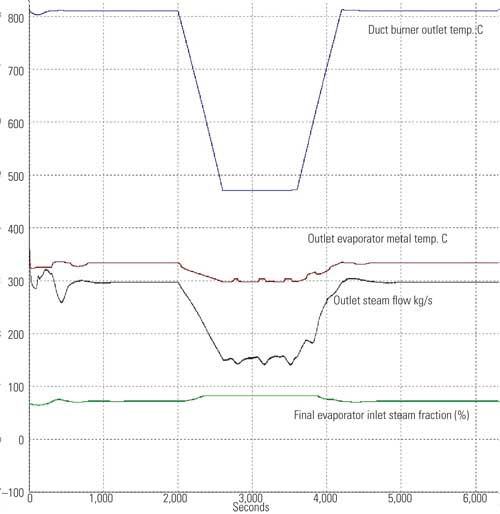
6. Simulating changes in input conditions. This graph shows a once-through HRSG’s dynamic response to duct burner shutdown and restart. Courtesy: Tetra Engineering Europe
Simulation’s Benefits
Boiler simulation can be a useful tool for in-depth investigation of various operating issues in an HRSG. The examples presented here used relatively straightforward steady-state models to look into some common operating issues. More complex models can be used to look at other issues of interest, such as checking if temperature and pressure values remain within OEM ramp limits on start-up or shutdown, or testing the effect of nonhomogeneous (stratified) gas temperature and flow distributions on HRSG performance.
—Christian Daublebsky von Eichhain ([email protected]) is the chief engineer for KED GmbH, Rodenbach. James W. Malloy ([email protected]) is the technical director for Tetra Engineering Europe, and Mark J. Taylor ([email protected]) is the senior consulting engineer for Tetra Engineering Europe.