2009 Industry Forecast: Existing Generating Assets Squeezed as New Project Starts Slow
Most forecasting reports concentrate on political or regulatory events to predict future industry trends. Frequently overlooked are the more empirical performance trends of the principal power generation technologies. Solomon & Associates queried its many power plant performance databases and crunched some numbers for us to identify those trends.
Market forces in the worldwide power generation industry have been dramatically changing over the past several years. Fuel prices, deregulation, environmental regulation, and renewable energy additions all interact and affect generating unit operations. To investigate the utilization, reliability, and cost manifestations of these forces, HSB Solomon Associates LLC (Solomon) evaluated operational performance trends over the past six years, concentrating on North American and European thermal generating units across conventional steam (that is, Rankine cycle) generation and combined-cycle technologies.
Though some basic trends are well known from reading news articles and industry sources, other trends might not be so obvious. As an example, utilization is well known to have been changing over the past few years due to fluctuations in fuel prices. But whereas the trends in reliability may not have changed significantly, there are very poignant lessons to be learned by investigating the components of reliability to understand whether there is a trend toward proactive or reactive maintenance. To that end, this investigation looked at the more difficult-to-recognize trends in generating unit operations.
Study Methodology
The areas of investigation included:
-
Reliability. Equivalent unavailability factor (EUF) and equivalent forced outage rate (EFOR) as defined by the North American Reliability Corp. (NERC) Generation Availability Data System (GADS).
-
Utilization. Measured net output factor (NOF) and net capacity factor (NCF) as defined by NERC GADS.
-
Cost. Operating costs were segregated into total cost less fuel (TCLF) and fuel cost.
Data for each region, technology, and timeframe were compiled from Solomon’s proprietary database of power generation operating and financial performance. For EUF, EFOR, NOF, and NCF, a two-year average was used in conjunction with a yearly average to capture the effect of annual variations in overhauls.
Inferring industry trends solely by using classical statistics (for example, averages with confidence intervals) can overlook information contained within the data. Skewness, kurtosis, distribution forms (for example, bimodality), and other shape/value changes in the data are important in identifying and understanding trend dynamics. For that reason, a Monte Carlo – based resampling with replacement procedure (statistical bootstrapping) was used to compute standard statistics estimates (mean, standard deviation, percentiles, and the like), as well as more detailed results that provide insights into or information relating to the actual shape of the industry distributions and their effect on the trends.
Predicted Results
The statistical results for the North American and European conventional steam analysis are presented in Table 1. Table 2 presents the North American and European combined-cycle results.
An in-depth analysis for North America and Europe is presented in the following sections by region and generation technology.
North American Trends
North American steam-coal and combined-cycle generation markets have experienced significant impacts due to fuel price increases, regional dispatch changes, materials price increases due to new or retrofit projects, and demand for skilled labor resources. How these impacts manifest themselves within the operational results is described below.
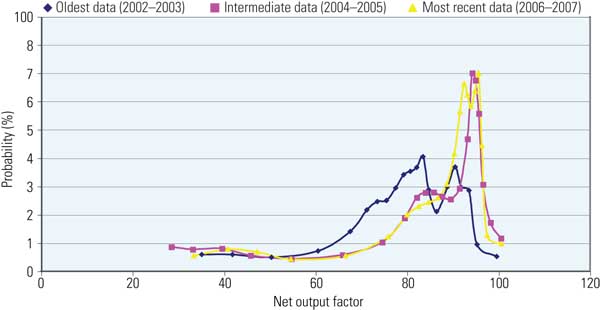
Steam Plants. One of the more interesting results of the North America steam generation analysis involves utilization, which has been steadily increasing over the past several years (Figure 1). The peak of the graph is shown to rise and move steadily toward the right, which can be interpreted as a greater probability that any given unit in North America will have a higher NOF in 2006 – 2007 than in 2004 – 2005 and 2002 – 2003.

1. North American conventional steam plant net output factor probability. Source: HSB Solomon Associates LLC
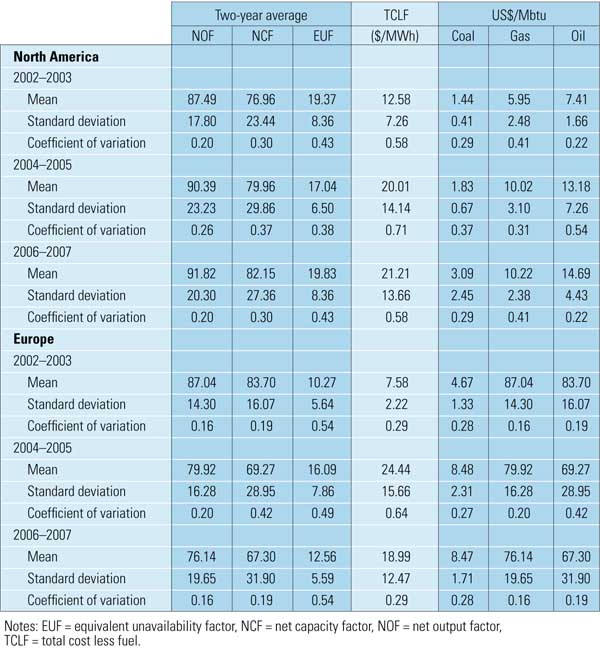
It is a well-known fact that as natural gas prices increase, coal prices also increase. This trend is relevant because for a conventional steam group — comprising mostly coal-fired units — higher utilization has been achieved in the face of increasing fuel prices. That indicates both continued and increased dependence on coal generation. Another important factor of this performance involves the volatility in fuel pricing, which was greatest during 2004 – 2005, as indicated by the spike in the coefficients of variation (0.37 during 2004 – 2005 as compared to 0.29 in 2002 – 2003 and 2006 – 2007). Thus, despite fluctuating fuel prices, North American generators were still able to increase utilization.
During this same period of increased utilization and fuel prices, utilization has not affected the units’ availability performance. EUF has remained relatively constant over the six-year period, as shown in Table 1.

Table 1. Key operational indices for conventional steam generation. Source: HSB Solomon Associates LLC
Given the economic downturn during the latter part of 2008, lower demand for electricity will follow, as manufacturing adjusts for slower sales, and fuel price volatility should moderate as demand for electricity eases. If predictions for a long, slow economic recovery are proven correct, fuel prices should stabilize over calendar year 2009. Furthermore, significant price signal changes, driven by the incoming Obama administration’s energy policy changes, could easily take 12 months to be fully understood, further delaying significant shifts in demand-related fuel price changes.
In line with reduced economic activity as economies climb out of the recession, which began in December 2007, utilization by power generators should also fall off with slower demand growth, or even negative growth.
In addition to the economic uncertainties of late 2008, power producers are faced with additional uncertainty in the area of environmental regulatory planning, as a result of the Clean Air Interstate Rule being set aside during summer 2008. The need to control cash while coping with reduced revenues during an economic recovery, plus the necessity of waiting for clearer environmental regulatory signals from the new administration, is likely to result in some deferrals in plant upgrades and plant betterment projects. We expect the availability of Rankine units to climb during 2009 as new planned major projects (and associated outage time) are deferred, awaiting greater regulatory clarity.
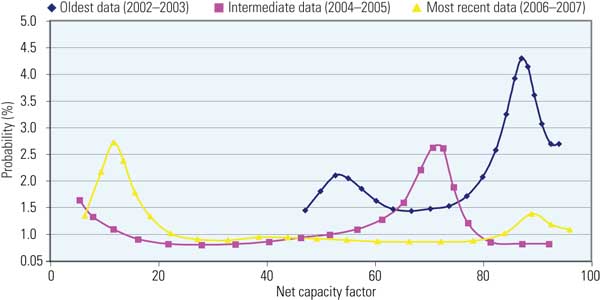
Combined-Cycle Plants. Utilization has made distinct shifts over the six-year period we studied. Mean utilization in terms of NCF moved from 87% in 2002 – 2003, to 72% in 2004 – 2005, to 12% in 2006 – 2007, as shown in Figure 2.

2. North American gas-fired combined-cycle plant net capacity factor probability. Source: HSB Solomon Associates LLC
By 2006 – 2007, most of the combined-cycle blocks were in the low range of NCF; the remaining high NCF blocks during this period were principally cogeneration blocks. Such a trend can be attributed in large part to natural gas prices. Should these conditions continue, combined-cycle power block owners face a significant challenge to their continued profitability.
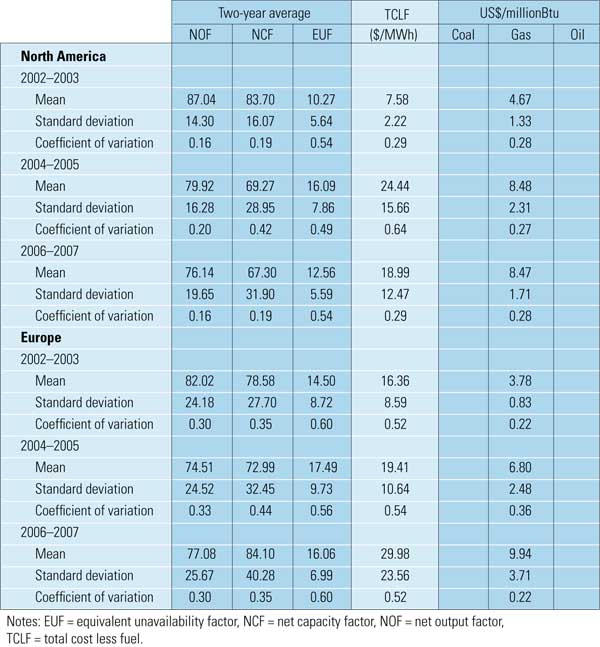
As shown in Table 2, TCLF has increased from $7.58/MWh in 2002 – 2003 to $18.99/MWh, peaking at $24.44/MWh in 2004 – 2005. Considering the drop in NCF previously discussed, the increase in TCLF can be attributed to spreading operations and maintenance (O&M) costs over fewer megawatt-hours. Less-significant impacts could be explained by deferrals in spending or reductions in resources being applied to these power blocks to control fixed costs during low-dispatch years, which may have limited the upward trends in nonfuel production costs.

Table 2. Key operational indices for gas-fired combined-cycle plants. Source: HSB Solomon Associates LLC
Going forward, recent estimates of natural gas prices remain in the range of $8 to $9. Combined with low electric demand growth during 2009, high utilization of coal, deferred major projects, and continuing construction of wind farms, no recovery in combined-cycle utilization can be foreseen through 2009 or even 2010.
European Trends
The most pronounced trends emerging from the analysis of European assets involve combined-cycle units.
Utilization is particularly interesting in Europe. As in North America, its general history is widely known, but the details are not all readily apparent. As indicated in Figure 3, utilization (in terms of NCF) reflects the impacts of climate change and Kyoto Protocol commitments appearing in Europe in January 2005.

3. European gas-fired combined-cycle net capacity factor probability. Source: HSB Solomon Associates LLC
The 2004 – 2005 period was associated with the highest volatility in utilization measures, as indicated by a 0.44 coefficient of variation (see Table 2), compared to values of 0.35 and 0.35 in 2002 – 2003 and 2006 – 2007, respectively. Considering that European Union (EU) nations began trading carbon emissions in January 2005, this trend in volatility makes sense. Volatility diminished in the 2006 – 2007 period, when carbon prices dropped to lower levels because of the overallocation of carbon credits.
We expect in 2009 that adjustments to the carbon credits market by the EU will show that European combined-cycle units will maintain utilization levels similar to those in 2008, or rise slightly. Economic recovery in global markets will be incrementally smaller and will temper any significant utilization increases for these combined-cycle plants.
The observation in the European market is particularly pertinent to North America. If the new administration institutes carbon cap-and-trade or carbon tax initiatives, it is likely that the first year will see higher volatility in performance measures. The market will require time to find equilibrium once new rules are established.
The mean unavailability of these combined-cycle plants has stayed relatively constant in terms of EUF: in the range of 18% to 19%. Because EUF includes both planned and unplanned events, it begs the question of whether the EUF is staying constant in both areas or if there is relative movement between the components. If the combined-cycle plants are being utilized less, major maintenance intervals are likely being extended over time. However, if EUF is staying constant while planned overhaul intervals are extending, that implies that the change for these combined-cycle blocks is due to higher unplanned or forced outage contributions within the EUF indicators.
Given the volatility exhibited in NCF under varying market conditions, the impacts on EFOR were investigated, and they showed some very interesting trends (Figure 4).

4. European gas-fired combined-cycle equivalent forced outage rate. Source: HSB Solomon Associates LLC
Over the study years, the area under the curve in Figure 4 is contracting and shifting to the right. For example, consider a constant probability of 90%. In 2002 – 2003, there was a 90% probability that for any given plant EFOR would be 12.43%, whereas in 2006 – 2007, there was a 90% probability that EFOR for any given plant would be 15.86% — an increase of almost 3.5%. Considering that the high range of the curves typically involves much higher severity of failures, this trend suggests that there is a greater chance of having higher EFOR as well as more-severe events. Combining this effect with our understanding of the volatility in NCF, it appears that the changes in market forces are affecting asset performance.
We expect this trend of increased unplanned outages to continue at similar levels as further changes in regulations are worked out during 2009 and as plant O&M staffs make adjustments and further enhance their use of condition-based maintenance programs.
We have seen evidence in multiple markets, using different power generation technologies, that when significant market changes are taking place, management adjustments to changing operational scenarios can sometimes take one, two, or more years before O&M programs are able to bring performance measures back under control.
Changing operating scenarios; adjusting to new market, regulatory, and technology upgrades; and the like all call for reassessing the performance of generating assets on an ongoing basis. It should be no surprise that generating assets that are given "Top Performer," "Pacesetter," or similar recognition are driving their business through ongoing performance monitoring, a better understanding of performance metrics, and attention to internal and external comparison data. Such practices enable generators to learn from other markets or technologies, facilitate better business planning, and adjust more quickly to volatile markets — like the ones we’re likely to see in the days ahead.
—Richard B. Jones, PhD ([email protected]) is director, statistics and risk modeling; and Eric Tiffany ([email protected]) is senior vice president, power vertical, for HSB Solomon Associates LLC.