Wind and Solar Cross 10% U.S. Generation Share as Prices for Solar Keep Falling
Marking a significant milestone, power generation from the combined utility-scale and small-scale wind and solar installations in the U.S. surpassed 10% of the nation’s total power generation in March, according to the Energy Information Administration (EIA).
The news comes on the heels of an announcement last week by the Solar Energy Industries Association (SEIA) that installed system prices for solar systems have fallen across all market segments. Also for the first time, fixed-tilt utility-scale systems dipped under the $1/W barrier, SEIA said.
Breaking the Barrier—on a Gigawatt-Watt Level
The EIA said on June 14 that generation from wind and solar has grown steadily since 2007. On an annual basis, wind and solar generation made up 7% of total U.S. power generation in 2016.
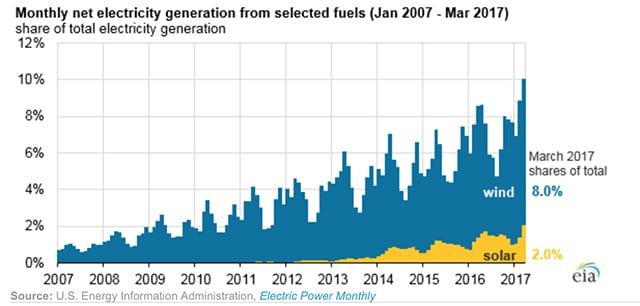
The EIA noted that wind and solar follow seasonal patterns. Wind patterns vary based on geography. Wind generators in Texas and Oklahoma, for example, have their highest output in spring, while California generators see a boost in output in the summer. “Based on seasonal patterns in recent years, electricity generation from wind and solar will probably exceed 10% of total U.S. generation again in April 2017, then fall to less than 10% in the summer months,” it said.
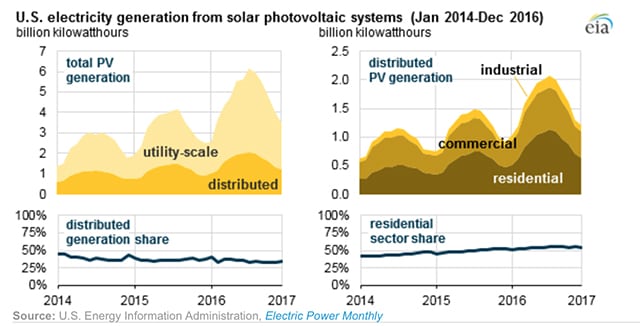
Earlier this month, the agency said that the share of small-scale photovoltaic (PV) systems—of up to 1 MW— doubled between 2014 and 2016, making up 37% of annual generation from all U.S. solar PV generators in 2016. Utility-scale solar plants have, meanwhile, grown in size, from 10 MW plants entering service in 2014 to more than 17 MW for plants entering service in 2016.
Solar Capacity Growing Exponentially
In its latest quarterly SEIA/GTM Research U.S. Solar Market Insight report released on June 8, SEIA and GTM Research said that about 2 GW of new solar capacity was installed during the first three months of 2017, a slight decline compared to last year. However, it expects U.S. solar PV capacity to nearly triple over the next five years. By 2022, the report predicts that more than 17 GW of solar PV capacity will be installed annually.
One driving factor is falling costs. In the first quarter of 2017, average pricing for residential rooftop systems was $2.84/W. Costs for non-residential installations were about $1.56/W. Utility fixed-tilt and single-axis tracking projects saw average pricing of $0.99/W and $1.08/W, respectively. “That represents a respective 6.2% and 5.9% price reduction from last quarter,” the industry group said.
Over the past few years, U.S. module price trends have been driven by antidumping and countervailing duties on Chinese suppliers, SEIA said. “But recently the main driver has shifted; current module price trends are largely a result of supply-demand imbalance, with prices continuing to slump. During Q1, the quarterly average delivered price for Chinese producers ranged from $0.35/W for order volumes greater than 10 MW to $0.40/W for order volumes of less than 1 MW on the high side.”
SEIA noted that “uncertainty looms over the long-term outlook for U.S. solar,” owing to a new trade dispute recently initiated by domestic module and cell manufacturer Suniva. The International Trade Commission announced in May that it would consider Suniva’s petition under Section 201 of the Trade Act of 1974. “This petition could result in ‘remedies to safeguard against foreign-manufactured crystalline silicon photovoltaic products,’ including import tariffs, volume limitations, or other measures,” SEIA said.
—Sonal Patel is a POWER associate editor (@sonalcpatel, @POWERmagazine)