TREND: Down Go Electricity Prices
Wholesale electricity prices are in what appears to be a long-term downward spiral, according to the Department of Energy’s Energy Information Administration. Prices across the country were down in 2012, the EIA reports, on top of significant declines already on the books for 2011.
This chart from EIA (Figure 1) shows the decline in wholesale prices region-by-region. The story is much the same across the country. According to the EIA data, both peak and off-peak wholesale prices declined in 2012 versus 2011. On-peak (weekdays from 7 a.m. to 11 p.m.) day-ahead prices dropped by 15% in the California ISO (where the average on-peak price in 2012 was $31.72/MWh). That was the lowest decline in EIA report.

1. Peak and off-peak spot electricity prices dropped significantly in 2012. Source: EIA.
The biggest drop came in the Electric Reliability Council of Texas Houston zone, with a 45% decline compared to 2011, with an average price in 2012 of $35.91/MWh. The lowest-cost region, the Pacific Northwest with its plentiful hydropower, saw 2012 average on-peak prices of $22.56/MWh, a healthy 24% decline. The large ERCOT price decline, said EIA, reflected special circumstances: “a return to more typical pricing in 2012 compared to the significant to the significant price in the summer of 2011.”
The highest average on-peak electricity prices, according EIA, were in the New York ISO, at $46.57/MWh, a 27% decline. According to EIA, “In wholesale electric regions where prices declined in both 2011 and 2012, the drops in 2012 were generally larger.”
The same pattern held for off-peak (nights and weekends) prices, “although the decreases were much less dramatic than in on-peak prices.” The only place off-peak prices were up in 2012 was in California. That phenomenon, says EIA, was the result of the prolonged outage of South California Edison’s San Onofre nuclear power plant. Nukes generally run continuously, so they produce large amounts of power in periods when demand is very low. The lower off-peak prices in California in 2012, says EIA, “reflect the cost of replacing the less-expensive generation from nuclear units.”
Two factors—natural gas and warm weather—account for the substantially lower electricity prices last year, says EIA. “Natural gas prices were consistently falling throughout the latter half of 2011 and into 2012,” says the statistical agency. “Because natural gas generators often set the market-clearing price for electric power, wholesale electric power prices often trend together with natural gas prices.”
Another recent EIA report highlights a major aspect of the story of the rise of natural gas in electric market: the march of gas from the Marcellus Shale through the middle-Atlantic states. Fig. 2 is EIA’s graphic demonstration of the impact of Marcellus gas is having on the Algonquin Gas Transmission system, the major pipeline serving New England. The region has long used natural gas mostly for home heating and Algonquin’s traditional pattern has seen pipeline capacity at its highest in the “high-demand winter season.”
No more. “But so far in 2012 (Jan 1-Sept 20) it has operated at much higher levels year-round as rising natural gas demand from the power sector, coupled with reduced liquefied natural gas imports, have increased flows on pipelines into the region.”
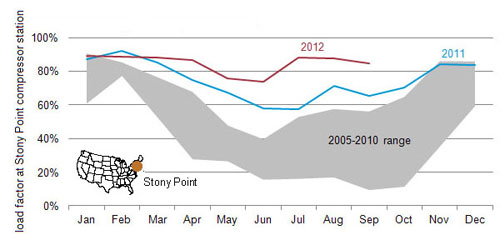
2. The influx of shale gas from the Marcellus region has resulted in substantially increased flows on the Algonquin pipeline. Source: EIA.
From June to August of 2012, traditionally a low-point in Algonquin’s throughput, the pipeline “averaged a winter-like 83% load factor (the amount of pipeline capacity that is being used),” said the EIA. “This is up from a 62% load factor for June-August 2011 and well above the average load factor of only 32% from June-August in the year 2005-2010.”
EIA adds, “A major factor of the year-round higher pipeline capacity utilization into New England is the increased amount of natural gas used at power plants, referred to as power burn. So far in 2012 (Jan 1-Sept 20), power burn has averaged 5.86 billion cubic feet per day (Bcf/d), 66% above the 2005-2010 average. Summer power burn (June-August) averaged 7.11 Bcf/d in 2012, a 45% increase from the 2005-2010 average. The consistently higher level of natural gas use at power plants places additional pressure on pipelines to serve those customers while balancing maintenance and outage schedules, which are typically performed during periods of lower natural gas demand.”
—Kennedy Maize is MANAGING POWER’s executive editor