Top Plants: Four Plants Demonstrate Global Growth of Nuclear Industry
The global nuclear industry is moving forward at a brisk pace, only slightly slowed by the Fukushima Daiichi accident. The International Atomic Energy Agency’s most realistic estimate is that 90 new nuclear plants will enter service by 2030. Ten new nuclear plants went online over the past two years. We profile four of them as POWER’s nuclear Top Plants for 2011.
Nuclear power generation is a global enterprise—more so today than ever before. The Fukushima Daiichi accident illustrates that what happens in Japan does not stay in Japan but rather has many international ramifications for those in the business of making electricity. In response to the Japanese disaster, some nations reiterated their commitment to nuclear power generation, many just watched and waited, and one immediately began the process of shutting down all nuclear plants. The U.S. held hearings, convened committees, prepared studies, and concluded that the country’s nuclear plants are still safe.
The U.S. has more operating nuclear power plants than any other nation on the planet, a fact often used to argue that the U.S. is the global nuclear leader. That argument is no longer persuasive because it fails to look prospectively at the industry. Any investor knows that past performance is not an indicator of future performance, an observation that applies equally to nuclear power. An astute investor will also study the market and identify high performers before making an investment. Today, the high performers aren’t in Western countries (North America and Europe) but are found in China, India, Russia, and other emerging countries. Unfortunately, Western countries are more spectator than participant, either mothballing operating plants or taking a wait-and-see approach to new builds.
Growth of nuclear power in the West was not always in the doldrums. In fact, Western countries led the growth of nuclear power from about 1960 to the late 1980s, when their share of global power generation reached 16%. Over the next few years, the percentage crept up to about 20%, a number that has remained stagnant for about two decades (and, coincidentally, the share of nuclear power in the U.S.). In the U.S., most of the growth in electricity produced by nuclear power over the past two decades is attributable to significant increases in plant operating availability and performance uprates, not new plant builds.
A Global Perspective
The International Atomic Energy Agency (IAEA) recently completed a reassessment of global nuclear plant builds in a post–Fukushima Daiichi world. IAEA Director General Yukiya Amano shared those results in his statement to the 55th Regular Session of the IAEA General Conference 2011 on September 19: “Following the Fukushima Daiichi accident, there was speculation that the expansion in interest in nuclear power seen in recent years could come to an end. However, it is clear that there will, in fact, be continuous and significant growth in the use of nuclear power in the next two decades, although at a slower rate than in our previous projections.”
The latest IAEA estimates of future builds are scenario-based and vary greatly depending on the set of assumptions used. The projections range from a “conservative but plausible” 90 units by 2030 to a “very aggressive” and highly unlikely “around 350” units. The projections are down about 7% from last year due—according to the IAEA—to the March 11, 2011 accident in Japan.
Plants Under Construction. For the purposes of this discussion, let us accept the IAEA’s most reasonable projection of 90 new nuclear units entering service by 2030. Globally, there are 433 reactors in service today, so that’s a growth of about 20% over the next 18 years, or about five new units entering service every year. That build rate is very conservative and much lower than what is occurring today.
Where will those new units be constructed? Western Europe is expected to reduce its reliance on nuclear power from 123 GW to 83 GW by 2030, so the growth won’t be in Europe. In North America, the IAEA projection represents a slight drop in capacity, from 114 GW to 111 GW. The epicenter of future nuclear construction has moved to Russia, China, and South Asia (India and Pakistan). Together, China (27), the Russia Federation (11), and India (6) represent two-thirds of the 65 plants now under construction. (See “The Big Picture,” p. 12 for a graphic presentation of plants under construction.)
Table 1 (p. 26) provides a snapshot of the level of activity throughout the global nuclear power industry, particularly with respect to the number of plants under construction and currently in operation. Table 2 provides another interesting perspective. It is fair to say that the number of plants that have begun construction over just the past two years shows the intensity of a country’s nuclear program today.
We can also compare the quality of operations at existing plants, country by country. After all, building many new plants doesn’t guarantee electricity will reach the grid in the future. A well-trained workforce of engineers, technicians, and operators, and a robust logistics infrastructure, are all required to support plant operations. The data seems to indicate that those same emerging countries that are building new plants are also operating their existing plants reasonably well, while others are on the steep part of the learning curve. The data show that U.S. remains a global leader (after Taiwan) when it comes to operating a fleet of nuclear plants (Table 1).
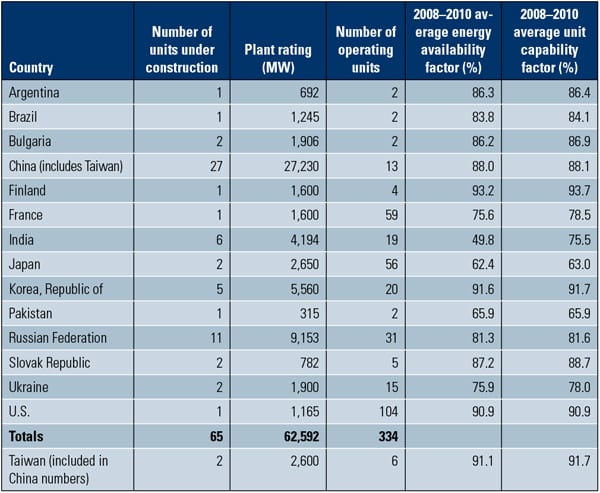 |
| Table 1. Active global market. As of October 3, 2011, 65 nuclear power plants were under construction worldwide, representing 62.6 GW. Energy availability factor (EAF) is the ratio of reference generation less planned, unplanned, and other losses caused by factors outside the plant, as a percentage. Unit capability factor (UCF) is the ratio of reference generation less the planned and unplanned losses to reference generation, as a percentage. For 2010 the worldwide weighted average EAF was 81%, and the worldwide weighted average UCF was 82%. Source: Compiled from several IAEA reports |
Table 2 shows the list of countries that have begun construction of a nuclear plant over the past two years. As expected, the countries that have the largest number of plants under construction are also those that have begun construction of the most plants over the past two years. The West hasn’t see a single new construction start over the past two years.
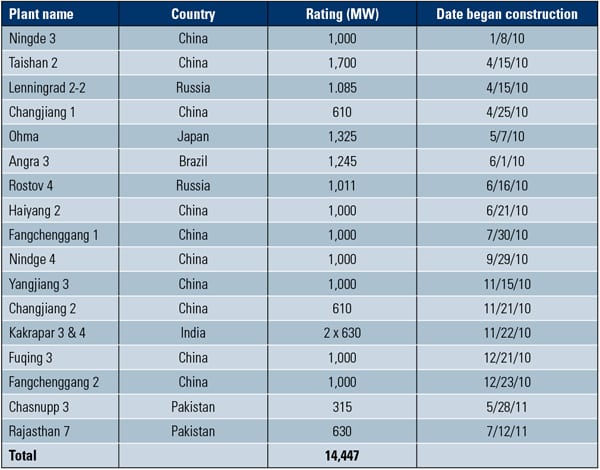 |
| Table 2. Plants that recently began construction. Construction began on 18 new plants, representing 14.45 GW, during the past two years. Source: IAEA |
Plants Starting Operation. The history of the nuclear power industry reveals that beginning construction often does not result in a plant that completes construction on time—or at any time, for that matter. Therefore, an interesting statistic is the number of nuclear plants that actually entered commercial service over the past two years. A similar list of countries appears in Table 3.
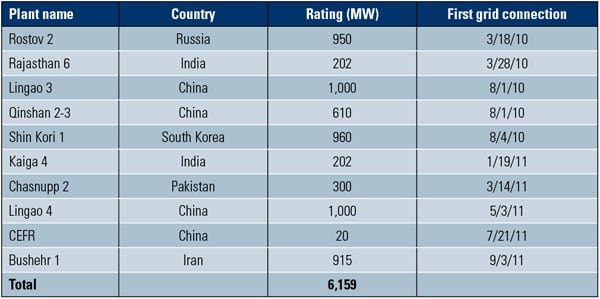 |
| Table 3. Nuclear plants that recently began service. Ten new plants, representing 6.16 GW, have been synchronized to their nations’ electricity grids over the past two years. Source: IAEA |
Plants Recently Shut Down. In the past, the annual list of plants that were permanently shut down was short and usually included units that had reached the end of their economic life. This time the list has only two old, small nuclear plants that were in the process of being decommissioned. Not surprising, four of the six units at Japan’s Fukushima Daiichi plant are on the list. Those four represent 2.7 GW of lost capacity (Table 4).
 |
| Table 4. Nuclear plants that were recently shut down. Fourteen plants, representing 11.49 GW, were permanently shut down during the past two years. Source: IAEA |
In the wake of the Fukushima Daiichi accident, Germany’s government elected to begin the process of closing all of its nuclear power plants. To date, eight plants have been permanently shut down, representing 8.4 GW. These eight represent the oldest of Germany’s 17 nuclear power plants. Another six plants are scheduled to be taken offline by 2021. The remaining three are scheduled to stay open until 2022 as a grid safety buffer. Before the shutdowns, Germany received 23% of its electricity from nuclear power.
Other countries—such as Japan, Italy, and Switzerland—are also backing away from nuclear energy. The U.S. nuclear power fleet is not immune. Several environmental groups joined to petition the U.S. Nuclear Regulatory Commission on October 8 to “freeze our Fukushimas,” a reference to the 17 nuclear power plants in the U.S. that use a General Electric Mark I reactor.
Left Behind
Overall, the IAEA data seem to show that countries with fast-growing economies have fully embraced nuclear power for the long haul. Is that because their economies are growing thanks to the increased use of nuclear power, or is nuclear power increasing because their economic growth provides capital for investment in nuclear power? Whatever the reason, each of those countries believes that nuclear power will be economic for many years to come and has decided to invest heavily in that electricity technology.
China, India, and Russia have been constructing new nuclear plants for some years and are fully committed to constructing new plants into the future. They expect to rely on nuclear power for the foreseeable future, as part of a diversified energy portfolio that also reflects heavy reliance on indigenous fuel sources, such as coal and gas.
The nuclear industry in the West appears to be stagnant at the moment, and with the shutdown of nuclear plants in Germany, the industry is beginning to contract. (See this issue’s “Global Monitor” for more on major industry players withdrawing from the nuclear arena.) In the U.S., new nuclear is now fighting a multi-front war. The rising cost of construction and much-lower-than-expected natural gas prices, plus a post–Fukushima Daiichi regulatory environment with a seemingly reenergized opposition, are likely to further slow forward progress.
A nuclear industry proponent may say that comparing the West’s approach to building new nuclear capacity to that used by China, India, and Russia is inherently unfair. In the U.S., the economic burden of constructing new plants is carried on the back of an individual company (and the public, by way of federal loan guarantees), while the cost of paying for plants in other countries is often the responsibility of that country’s government.
Another difference: The plants proposed in the U.S. are based on third-generation nuclear plant designs, whereas many of those under construction elsewhere are based on an earlier, and much less expensive, technology that is unacceptable in the U.S. today.
At the end of the day, each country will act in ways that further its own interests, whether that means doing nothing, building new plants, or shutting plants down early. Let us not forget that a “do nothing” option in time becomes a “shut plants down” decision.
— Dr. Rober Peltier, PE is POWER’s editor-in-chief.
