RAM Process Optimizes IGCC Design
New methods of reliability, availability, and maintainability (RAM) evaluation help facilitate more-accurate plant output and revenue predictions, identify strengths and weaknesses of possible plant configurations, and determine potential improvements and enhancements for integrated gasification combined cycle plants.
The ultimate goal for any power generation system is to meet or exceed the customer’s expectations for operation and efficiency. For an integrated gasification combined cycle (IGCC) plant, that means reliable operation, minimal planned outages, and producing the expected product yields. High plant reliability, availability, and maintainability (RAM) are among the key statistics that govern a project’s economic success.
RAM Methods and Techniques
A four-year research and development program by Siemens Energy and external technology contributors produced a RAM evaluation tool capable of assessing reliability and other performance factors for gasification and IGCC projects. This article introduces the different measures of RAM, describes how RAM is used in plant design, and concludes with a case study illustrating its application.
The new RAM evaluation tool evaluates system reliability characteristics and focuses on random failures over the plant’s useful life. Any failures that may be caused by inconsistent design (systematic errors) are not modeled but should be addressed with appropriate quality tools and methods during plant design. Failures that occur due to the effects of component aging are also not modeled but are addressed by plant maintenance and repair.
We begin our discussion of RAM evaluation tools with several important definitions:
- “System reliability” is a system’s ability to continuously maintain its desired function and is measured by the mean time to failure (MTTF).
- “Mean down time” (MDT) denotes the mean time between when a failure occurs and when the plant is back in service (Figure 1).
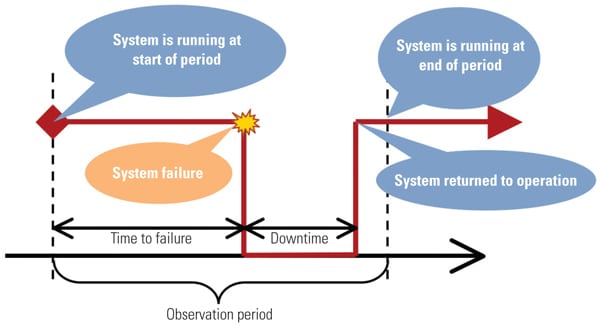 |
| 1. Key RAM definitions. The time to failure is the cumulative time from the start of steady state operation to a system failure event that requires shutdown of the given system and, perhaps, the entire plant. Down time is the length of time the system is out of service as a consequence of any one of all possible types of random failure that can occur in that system that results in an unplanned shutdown. Source: Siemens Energy |
- “Reliability factor” (RF) describes the percentage of time the system is delivering output and the time it is supposed to deliver output.
- RF is defined as MTTF/(MDT + MTTF).
- The sum of MDT and MTTF is the mean time between failures (MTBF).
- The familiar reliability measures above do not take into account planned outage hours (POH).
- System availability is defined as the ratio of MTTF and (MDT + MTTF + POH).
As with any real-world application, the measures of RAM listed above are not absolute and contain some uncertainty. Reliability and availability, for example, are mean values that reflect the expected average operational performance of a plant running over a long period. Shorter-period observation data typically will show variation from the average (Figure 2).
 |
| 2. Data are dynamic. The degree of RAM deviation for a particular plant is reflected in the distribution (assumed, calculated, or derived from operating data) of the corresponding value. For example, the statistical distribution of the plant’s unreliability factor is a function that describes the probability that a reliability factor of a plant will at least reach a certain value. Source: Siemens Energy |
There are various RAM analysis techniques, and making the right selection depends upon situation-specific factors. The following three techniques were used to construct the RAM evaluation model:
- Failure modes and effects analysis (FMEA) was used to analyze the consequences of single failures of individual parts of the system.
- Fault tree analysis (FTA) was used to capture the effects of mutually independent and dependent failures on the system.
- Markov models were used to describe the effects of consecutive failures and their repairs.
The types of data and the selection of an analysis technique should be familiar topics for plant designers. The challenge for those designers, however, is to bring together all the system and component RAM data; combine that statistical data into a comprehensive, predictive plant model; and then use that model to optimize the design and maintenance requirements of different plant configurations in order to select the option with the best life-cycle economics. Our interactive RAM modeling tool was developed to fully integrate this component- and system-level data analysis and to provide a convenient and user-friendly interface for analysis and comparative computations.
A comprehensive analysis must also consider the investment necessary to achieve strategic RAM design targets. Plant design requirements may impose limitations on the analysis such as those posed by a specific location, local regulations, or customer preferences. Optimization of the plant’s configuration must consider these constraints when calculating the possible benefits balanced against the incremental investment required for different design options. These capabilities are but a few of the many included in this robust and comprehensive plant RAM model.
Step-by-Step RAM Tool Development
A case study will illustrate the analysis steps and the methods and techniques applied to perform a typical RAM evaluation. We’ll first explore the calculation process and then apply the process to a case study plant to highlight the potential results, benefits, and improvements possible using these RAM techniques.
The approach described is not only applicable to an IGCC plant; it also can be used for any gasification plant configuration, such as a polygeneration facility, and theoretically can be used for other types of process plants. The modular nature of the RAM analysis tool makes it flexible because additional modules can be conveniently added to handle unique components and systems.
Build Reliability Modules. An IGCC plant comprises many different process units or islands. Using a top-down approach, the islands are separated and their interdependence is analyzed in order to build a detailed reliability model. The model must also capture each island’s configuration and the effects of single or multiple failure of discrete components. To incorporate the specific details and internal structuring of the gasification island into the model, the plant is further broken down into process subsystems or functional units that can be independently analyzed.
One major advantage of this analysis approach is that individual subunits are kept to a manageable size, which is an important feature when later reviewing the model for correctness and consistency relative to observed values.
For example, the gasification island has the following process subsystems (Figure 3) that are well-structured for analysis:
- The coal-feeding system sends pulverized coal to the reactor.
- The reactor converts pulverized coal into syngas and slag.
- The slag-handling system crushes the slag, and the granulated slag byproduct can be shipped offsite for disposal or use in various applications.
- Black water from the reactor is treated and filtered.
- Mechanical raw syngas treatment removes particulates, halides, and alkalines from raw syngas.
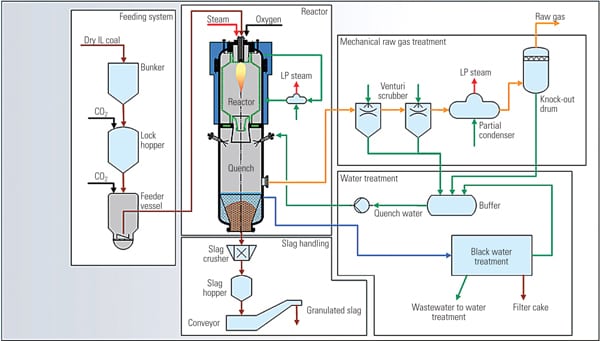 |
| 3. Final breakdown. When developing a RAM model of a gasification plant, the entire plant is first broken down into process subsystems or functional units that are of manageable size and that can be independently analyzed. This is an example of segregating primary systems for a gasification plant. Source: Siemens Energy |
Refine the Details. In the next step, the details of the subsystems are refined to fit the desired process island configuration by performing an FTA. At this point in the analysis, experience and market knowledge become crucial inputs to the model. The FTA requires collaboration with system experts through a review of system documentation such as piping and instrumentation diagrams or design documents using a FMEA-based approach. The individual components and elements of each subsystem are examined for functionality, redundancy, and the possible impact of the relevant failure scenarios on plant reliability.
Using this structured approach, the impact of individual elements on the system’s reliability, redundancies, and correlations are captured. The data required for statistical calculations of each component, such as MTTF and MDT, are then determined using field experience (where available), public and vendor databases, and expert estimations. Markov models are also used when sequences of failures and repairs, including repair strategies, are important and cannot be modeled with fault trees.
Verify and Validate the Model. Once the model is constructed and the system’s MTTF, MDT, and individual system and component contribution to (un)reliability are calculated, the hard work begins.
It’s crucial to verify that the model is realistic by checking its results against the design criteria and practical experience. If inconsistencies appear, adjustments must be made in the models using a two-phase approach. First, complete a top-down assessment whereby field data of systems and subsystems are compared with the calculated values. A bottom-up evaluation is then performed to assess the reliability structure and the model’s input data on a component-by-component basis relative to historical experience. Furthermore, the contributions of individual systems and subsystems are compared against the expectations and experiences of engineers and system experts.
Once any inconsistencies are resolved, the next step is to perform a sensitivity analysis—the process of optimizing the process island configuration. A big benefit of the sensitivity analysis is that it highlights which system components have the greatest influence on the system’s overall reliability and availability. These most influential components require the most critical review to verify data input quality.
Develop Event-Driven Simulation. After the model and the input data have been verified, key reliability statistical data for the system or its parts are developed by performing event-driven simulations. Failure and repair of system components are simulated by the model and determine the status of each component during a defined mission time. Using the fault tree structure, the system’s status is obtained and an evaluation of down time, the number of failures, and the RF, for example, for the tested scenario(s) is completed.
This experiment is then repeated as required to obtain an in-depth knowledge and understanding of the system performance. For example, to supplement the predicted system MDT and MTBF data, statistical methods can also be used to assess the variance of the key values of interest. For reasons that should be clear, establishing the system’s availability (or unavailability) distribution is of high practical value. The availability distribution over a specified time interval shows the estimated average time for possible system operation modes, including forced outages.
Once the simulations and statistical work are completed, the individual system’s reliability and availability distributions are then used to estimate overall plant performance and its expected output(s) over the design life of the project.
Optimize Maintenance Schedules. The RAM model of the entire plant can now be used to look for opportunities to improve plant performance, taking advantage of allowed tolerances in planned maintenance requirements provided by suppliers and practical experience. Because some constraints inherent in maintenance planning, such as the availability of skilled labor and timely delivery of parts, are not taken into account, the resulting maintenance schedule can only be considered an approximation.
Optimization strategies consider delaying maintenance (thereby saving dollars) as long as possible but not so long as to reduce plant reliability. The second aspect to consider is parallelization. If one process island in the plant is limiting or has limited product yields, then all upcoming and scheduled maintenance activities can be completed regardless of whether they may prevent a further decrease in system production. With this approach, the operator takes full advantage of a premature downtime rather than completing only those activities that correct the deficiency and performing remaining tasks at the latest possible point in the maintenance interval schedule. A third consideration is that there may be cases where it is more economical to complete maintenance on different systems successively versus simultaneously.
Taking into account all the information on the plant’s output characteristics (which are in turn dependent on the process configuration selected) and constraints due to the customer’s demands and the supplier’s recommendations, an optimal maintenance plan can be developed by solving what now becomes a discrete optimization problem.
The RAM model, in essence, can direct design decisions, such as determining the optimum number of installed spares and pump size selections (for example, 2 x 100% versus 3 x 60% sized pumps). The decision process also considers each component’s optimal planned maintenance schedule. The overall increase in plant availability due to smart maintenance plans is obviously bounded by the maximum effect that planned maintenance can provide. Although, in practical application, the range is actually smaller than predicted, any possible overall gain in availability is worth the effort. Improvements of even one to a few days of additional plant productivity are possible when compared to “first guess maintenance plans.”
Reaping the RAM Model Benefits
Next, a typical IGCC plant configuration is evaluated in a case study using these RAM techniques to find ways to increase plant output and, thereby, plant revenue. First, a base case configuration is modeled and computations for its RAM values are completed. Then a revised configuration that incorporates improvements deemed most beneficial is evaluated and the RAM gains are computed. The configurations used in the case study do not correspond to a particular operating or planned gasification plant but are presented to demonstrate the potential power of the RAM tool.
IGCC Plant Overview. IGCC and gasification plants are composed of many different process islands and individual systems that must be considered in a total plant reliability model (see Figure 3, for example).
The heart of an IGCC facility or gasification plant is the gasification island, where pulverized coal, steam, and oxygen are fed to the reactor (gasifier) for the generation of synthesis gas (syngas). Vitrified slag from the gasifier is either disposed of in a landfill or sold for market value. Liquid effluents are treated in the black water treatment plant and recycled. Particulates, alkalines, and halides in the raw syngas product are removed mechanically or by physical processes, such as condensation.
Downstream of the gasification island, carbon monoxide in the syngas is chemically “shifted” to carbon dioxide, and trace constituents are removed. The treated syngas can then either fuel a combined cycle power plant or be used as a feedstock for other chemical processes.
Case Study. The case study assumes that the base case IGCC plant configuration contains the following modules (Figure 4):
- One coal-milling unit configured as 2 x 50%.
- One air separation unit (ASU) with 24 hours of liquid oxygen storage.
- A gasification island with four gasification lines (25% each) served by two black water treatment systems, each with sufficient capacity for two gasification lines.
- One sour gas shift reactor.
- One acid gas removal (AGR) and sulfur recovery unit (“Claus Plant”) for gas treatment.
- One CO2 compression unit.
- One combined cycle unit that will produce electrical energy as the final output.
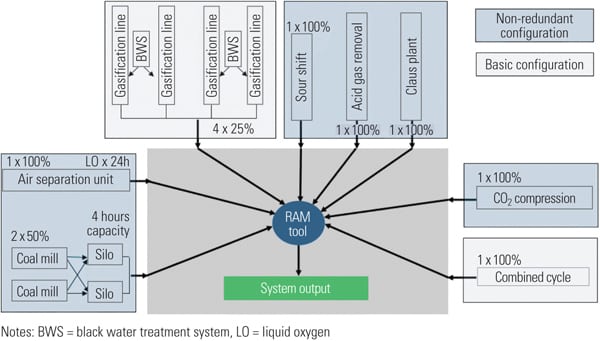 |
| 4. Before RAM analysis. The basic configuration of the gasification system that is part of an IGCC plant was modeled using RAM tools to obtain baseline performance, statistics, and operating economics. The reliability factor of the baseline design was 89.1% Source: Siemens Energy |
For each process island, the restrictions and requisites for planned maintenance are collected and integrated into the RAM tool, and maintenance plans are created. The reliability factor for each process island is then calculated using the process discussed earlier. The plant’s baseline reliability performance, against which alternative designs will be compared, is calculated using the RAM evaluation tool. For this example, an RF of 89.1% for the IGCC plant was calculated.
A sensitivity analysis will find which process islands have the largest impact on plant unavailability. Based on this information, configurations that may improve reliability and availability can be analyzed. Potential reliability improvements can then be assessed versus the resultant higher capital cost. An improved configuration that may increase RAM values in an economically reasonable way is illustrated in Figure 5.
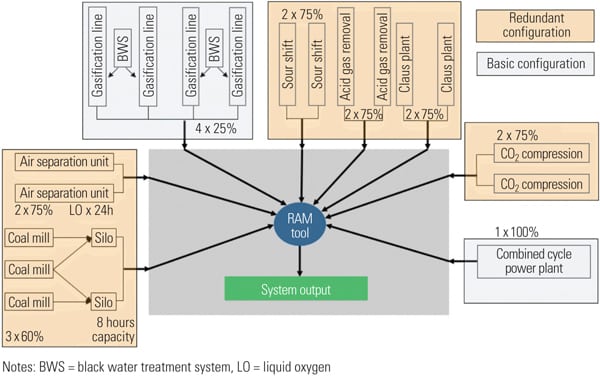 |
| 5. After RAM analysis. A RAM analysis found that an alternative plant configuration improved theoretical plant reliability by over three percentage points, to 92.4%, which is equivalent to another 10 days per year of plant operation. An economic analysis will determine if any or all of the reliability improvements listed in the table will be made to the baseline design. Source: Siemens Energy |
In this improved configuration, the gasification island and combined cycle unit remain unchanged. The components that changed include:
- The number and size of the coal mills were changed to 3 x 60%.
- The ASU, sour shift, AGR, and CO2 compression are configured as 2 x 75% units.
- The Claus Plant is provided with full redundancy, 2 x 100%.
As expected, the individual plant modules of the new configuration each showed improved reliability (see table). The improved system RF is calculated to be 92.4%—a sizeable gain of 3.3 percentage points. This RF gain equates to an extra 10 days of plant operation each year. The economics of the increased plant production less operating costs and amortized capital will determine if the physical changes are attractive to the owner.
 |
| Big improvement. RAM tools were used to calculate the increase in individual module and plant reliability of an alternative plant configuration. Source: Siemens Energy |
In this case study, the improved reliability projections were not unexpected because the changes mitigated the potential for single component failures that would lead to unplanned outages. Including installed spare capacity will allow repair of one component while the plant remains in operation. Also, each component will at some time require maintenance or replacement, and redundant equipment will help avoid even unnecessary planned outages.
Conclusions and Outlook
The RAM tool enables evaluation of relevant and practical plant configurations. It can be beneficial for specifying and assessing the practicality of reaching the plant’s high-reliability goals. Plant configurations can be adjusted and the calculated effects on reliability relative to additional capital expenditure can be evaluated.
The tool may also provide a framework to help with some ongoing risk and contingency calculations. It can even be used in operational phases where it may also help generate and optimize maintenance plans.
Siemens plans to focus future RAM development efforts on continuous improvement of the tool and its underlying database.
— Wolfgang Streer ([email protected]) is responsible for the development of tools, parts, and long-term services for Siemens gasification plants at Siemens Energy Service, Orlando. Diane Hollman ([email protected]) is responsible for the development of operation and maintenance programs for Siemens gasification plants at Siemens Energy Service, Orlando. Christoph Kiener ([email protected]) is responsible for Siemens Gasification Service programs in the Europe and Asia-Pacific regions at Siemens Energy Service, Erlangen and Freiberg, Germany. Stefan Rothbauer ([email protected]) is a research scientist at Siemens Corporate Technology’s Reliability & Availability Group in Munich. Francesco Montrone ([email protected]) is a senior research scientist and project manager at Siemens Corporate Technology’s Reliability & Availability Group in Munich, Germany. Ariane Sutor ([email protected]) is program manager for reliability and availability of technical systems and solutions at Siemens Corporate Technology, Munich, Germany.