Primer on Fuel Quality Analysis
Fuel quality is vitally important for combustion power plants, yet fuel quality testing is still uncommon and analyses often incorrect. Improved knowledge about the primary energy input to your power plant will help maximize your potential for improved operation and reduced generation costs.
Back in the “good old days” of the power industry, fuel was cheap, fuel supplies were fairly constant, air emissions regulations were loose, and power plant coffee was as dark as sin and worse for you. Since those days the power industry has seen tremendous change in every way—save for the coffee.
In those same good old days, fuel quality testing wasn’t given serious attention. So-called “short proximate” analyses were conducted monthly, but a full analysis might not have been done since the day the local beauty queen broke a champagne bottle on the turbine casing. Even when analyses were done, they were often rife with errors, ranging from simple typographical and mathematical errors, to blatant sloppiness. When I started my career in the power industry more than 20 years ago, I wondered how a power plant could pay so much for an analysis containing so many significant errors, and thus I learned to devote considerable time to checking for, advising upon, and fixing such errors.
One would hope that in this era of massively instrumented and logged modern power plants—struggling to cut costs while meeting performance, operations and maintenance, reliability, and emissions targets—that our fuel quality sampling and testing practices would significantly improve. Unfortunately, that does not seem to be the case, and as a result the power engineer is frequently called upon to review the fuel quality data assumptions and analyses that are conducted.
How serious is this problem? In my career I’ve reviewed well over 10,000 fuel quality samples, and I would estimate that perhaps 1 in 10 has a significant error that prevents a full and accurate analysis of the fuel without engineering judgment to correct the error. For example, I recently received 12 coal quality analyses from a power plant, and three of that 12—25%—featured some significant error or omission.
To help you avoid such problems, this article provides tips and guidelines for ensuring that you and your power plant staff have the best possible knowledge about your fuels.
It All Begins with Sampling
Understanding where, how, and when the fuel sample is collected will provide information on how representative that sample is of your average fuel quality. Unfortunately, fuel sampling is often considered just another messy chore, where someone takes a quick scoop of a coal pile with a bucket and pronounces “mission accomplished.” Unfortunately, this will often yield an inaccurate sample, especially as it may be possible that no one really knows what coal or coals are mixed together in that particular region of the pile.
A better way of sampling is to take directly from the train during the unloading process (Figure 1). Even better is to take small samples of coal from five or more train cars, as they are being unloaded, and mix the samples together to produce a composite coal for analysis. If sampling is being conducted during a performance test (Figure 2), the best method is often to collect equal samples at each of the coal feeders and combine these to create the composite sample.
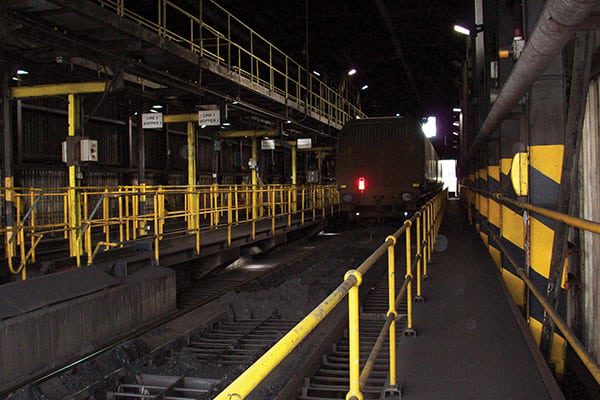 |
| 1. What’s really on that train? Not having an accurate measure of your fuel quality is like grocery shopping blindfolded. Courtesy: Una Nowling |
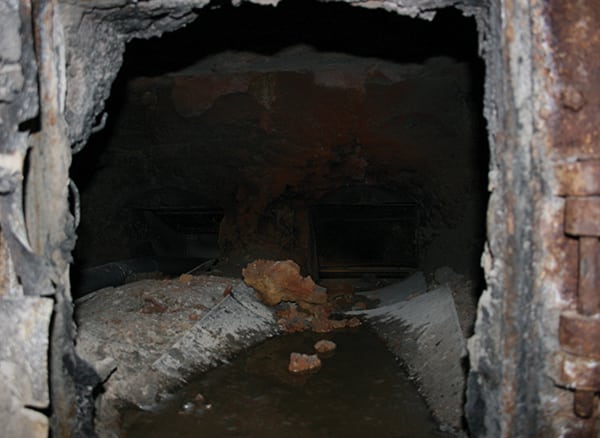 |
| 2. Ignorance is not bliss. The wrong coal was delivered for a test burn, and no analysis was done to provide operators with a warning. By Day 4, a clinker approximately 10 x 20 x 4 feet formed on the freeboard area, falling during turndown and destroying the bottom ash hopper. Courtesy: Una Nowling |
For the best sampling guidelines, refer to the engineering standards in use in your country. For the U.S. this would be the American Society for Testing and Materials (ASTM) standards. Good examples of sampling standards include ASTM D 2234/D 2234M-07 for belt samples, D 6883-04 for sampling from stockpiles and delivery vehicles, and D 4596-99 for mine samples.
Which Tests Should Be Conducted?
After a representative sample has been safely collected, the next step is determining what tests should be performed upon the sample. The answer to this depends upon what your goals are for attempting to solve fuel quality–related problems at your power plant. Here’s a look at the typical coal analyses, in order from least to most complete, and what impacts they can help predict:
■ The most basic analysis, a “short proximate,” will typically consist of the heating value, moisture, ash, and sulfur in the fuel. This is a barely acceptable analysis, which will only allow one to make general estimates about the plant performance.
■ A full proximate analysis will add volatile matter and fixed carbon to the results, which can be useful for determining unburned carbon, CO production, coal fineness requirements, excess air requirements, and the like.
■ An ultimate analysis will provide the carbon, hydrogen, nitrogen, sulfur, ash, moisture, oxygen, and (sometimes) chlorine. With this analysis one can determine combustion air and flue gas calculations, calculate boiler efficiency, estimate NOx production, and estimate boiler tube corrosion rates.
■ An ash mineral analysis will provide a breakdown of the minerals contained in the ash on an elemental scale. An ash mineral analysis will assist in predicting slagging and fouling in the boiler, ash erosion and corrosion, ash resistivity for collection in electrostatic precipitators, and more.
■ A Hardgrove Grindability Index (HGI) analysis will assist in determining the expected mill capacity.
■ A trace element/heavy metal analysis will help determine such effects as mercury emissions and the potential for fouling of your selective catalytic reduction catalyst.
Other tests are often conducted on a site-specific basis, such as testing the free swelling index, ash viscosity T250 temperature, sulfur forms, and even computer-controlled scanning electron microscopy (CCSEM) to determine the mineral forms and quantities in the fuel. With all of these types of analysis, accurate processes and data recording are essential (see sidebar).
| The Good, the Bad, and the UglyAt some point you may wonder whether a poor analysis is better than no analysis at all. Here’s the problem with that line of thinking: A poor analysis can give you a false sense of accuracy, whereas with no analysis, you have to admit you don’t know a blessed thing about the fuel quality.
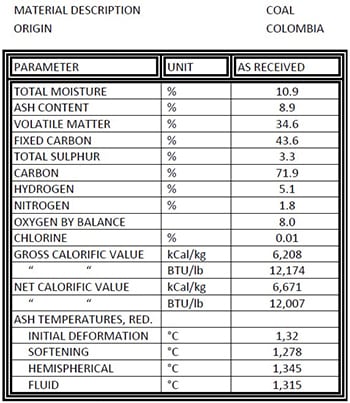
The analysis in Figure 3 was taken from an actual ship bill of lading from late 2013, and it contains so many major errors that any scientific analysis was impossible. This begs the questions: Why was this provided to the power plant without anyone checking it? Can any analysis from this supplier be trusted in the future?
|
Reviewing the Results
After establishing that the sampling process was done correctly, your fuel data should be reviewed via several different processes to ensure you have the best data for performing your calculations.
Internal Consistency. Checking for internal consistency involves checking for mathematical and typographical errors. The first thing I do is convert the proximate and ultimate analyses to an “as received” basis. Next, I ensure all of the components of the proximate analysis sum to 100%, and repeat this effort for the components in the ultimate analysis. My rule of thumb is that both the proximate and the ultimate analysis should each sum to 100% +/–0.5%.
In addition, the moisture and ash values should be the same between the proximate and ultimate analysis. If the proximate analysis sum is within acceptable ranges but not 100%, I adjust the moisture content (and repeat the adjustment for the ultimate analysis). Then if the ultimate analysis components still do not sum to 100%, I adjust the oxygen content.
Note that although it is not part of the ASTM ultimate analysis, chlorine is often reported along with it. If that is the case, include chlorine in your summation of the components.
Due to the nature of the testing that is conducted, the ash mineral analysis can have looser boundaries. I typically accept an analysis that sums to 97% to 101%. I adjust the analysis to 100% by adding or subtracting from the “unknown/other” category. If this will not work, then I tend to normalize the entire analysis such that the components sum to 100%.
There are three sources of internal error possible with the heating value of the fuel. First, you should confirm that the value is entered and properly labeled on either a higher (gross) or lower (net) basis. Next, you should check that the heating value is on an “as received” basis. Finally, you should verify that the proper measurement units have been listed (Btu/lb, kcal/kg, kJ/kg, etc.).
Next, the ash fusion temperatures and ash T250 viscosity temperature should be checked to ensure they are measured in the correct units (degrees F or C). The ash fusion temperatures should steadily increase in value, from the initial deformation temperature through to the fluid temperature. The HGI should be checked to ensure it is not suspiciously high or low; sometimes considerable error occurs during testing. Unless you have experience with the type of fuel being analyzed, any HGI lower than 35 or higher than 65 should be confirmed. Also note that the HGI test is of much less value for non-coal fuels, and it is often useless for biomass fuels.
External Consistency. Checking for external consistency means comparing the fuel in question with other fuels of that same type to understand how “typical” the fuel is compared to its peers.
For example, a Powder River Basin (PRB) coal with a moisture content of 10% and higher heating value of 12,500 Btu/lb should immediately raise a red flag. As you collect analyses of fuels in your career, you should build a knowledge base using a spreadsheet or database that can allow for a quick external consistency comparison.
Common Problem Areas
Several issues are common problems when reviewing fuel analyses. Ask, and carefully consider the answers to, the following questions.
Is the heating value consistent with the ultimate analysis? Performing a quick heating value estimate via an equation such as the Dulong formula can greatly increase your confidence in the accuracy and internal consistency of both the heating value and the ultimate analysis. The Dulong formula is a simple formula that, in my experience, yields surprising accuracy for most U.S. coals:
Higher Heating Value, Btu/lb = 14,600 x C + 62,000 x (H – O/8) + 4,050 x S,
where C, H, O, and S refer to the as-received mass fractions of carbon, hydrogen, oxygen, and sulfur, respectively.
Typically, if the Dulong-calculated heating value differs from the given heating value by more than +/–300 Btu/lb, I take a harder look at the heating value and the ultimate analysis to ensure they are accurate.
What is the moisture basis? It is very common to see an as-received or “wet” analysis reported as “dry,” or vice-versa. You can confirm the moisture base by simple math: If a proximate analysis is “wet,” then the moisture, ash, volatile matter, and fixed carbon must sum to 100%. If they sum to 100% plus the moisture, then the analysis is on a dry basis.
Converting to a different moisture basis is a simple arithmetic function. To convert a dry analysis value to as-received:
Valuewet = Valuedry x ((100 – moisture, %) / 100)
To convert an as-received analysis value to dry:
Valuedry = Valuewet x (100 / (100 – moisture, %))
Does it use air-dried basis? Air-dried base results are sometimes impossible to convert to a “wet” or “dry” basis, because one requires the “as-received” moisture content in addition to the air-dried moisture for completeness. Often one of these is omitted from the analysis.
Is the heating value on a higher (gross) or lower (net) heating value basis? Errors abound here when purchasing world-market coals. Note that the lower heating value by definition will always be less than or equal to the higher heating value.
Has the ultimate analysis divided the moisture into hydrogen and oxygen? Although this is becoming less common, one still finds this error in some analyses. For the sake of simpler calculations, it is preferable to keep the moisture separate from the hydrogen and oxygen analyses.
Is the equilibrium or inherent or air-dried moisture greater than the total moisture? In some cases this occurs due to performing analyses on two different samples. However, given the importance of moisture on your engineering calculations, it’s a problem you should work to resolve.
Is the ash content suspiciously low? Sometimes the person taking the samples will excessively “hand screen” rock, pyrites, clay, and other inorganic materials from the sample. This can be especially problematic with biomass fuels, where the power plant should expect the possibility of significant inorganic material sometimes coming along for a ride with the fuel. The solution is to adhere to official sampling guidelines.
Are the oxidizing ash fusion temperatures higher than the reducing ones? This should be the case for nearly all coals and biomass fuels. However, petroleum coke and some biomass fuels can see these trends reversed.
Is chlorine in ppm, or %? If chlorine is only listed in the trace element or another analysis, it can sometimes be omitted from consideration. This is a critical mistake when analyzing high-chloride fuels. Note that if chlorine is included with the trace element analysis, it is typically on a whole-coal dry basis.
Is the ash mineral analysis on an SO3-free basis? Some laboratories list the ash mineral constituents exclusive of SO3. If this is not taken into account, it can lead to significant errors when attempting to estimate the slagging, fouling, erosion, and corrosion potential of a coal ash.
Analysis Matters
To a large extent, the errors in your fuel analysis will set the minimum level of error in any plant calculations that depend upon the fuel quality. A 5% error in your higher heating value will result in a minimum 5% error in your fuel burn rate calculations, said error cascading through to your airflow, flue gas flow, mill throughput, emissions, and other calculations.
Sometimes fuel analyses are not conducted due to a lack of time to carry out and conduct the analysis. Determining the frequency of sampling will depend on the fuel-related concerns and fuel quality variability experienced at the plant. For example, a plant that receives coal from the same PRB coal source every week and that has no significant fuel-related problems should probably only test one train a month (or less). However, a plant that receives a variety of different coals or that suffers from frequent slagging problems might want to sample coal from the feeders weekly, or even daily in some cases. If the plant is experiencing highly unusual behavior, then many tests per day at the feeders may be required.
The process of checking the analyses of the fuels you’ve tested is made simplest by developing a spreadsheet of all fuel analyses that are received, and then developing macros to perform the checks discussed in this article. This sort of exercise can be a good project for engineering interns, and can help instill an awareness of the importance of fuel quality early in their careers. For more advanced efforts, one could employ an Access database, or even a web- or cloud-based intranet database to create an intelligent fuels library that is accessible fleetwide. In the long run, the cost of increasing your awareness of the diet of your power plant is relatively small but has the potential to yield significant benefits.
How Many Errors Did You Find?
Here are all of the problems with the coal analysis presented in the sidebar:
■ The proximate analysis only sums to 98%.
■ The ultimate analysis appears to be on a dry basis instead of as-received, because summing everything save the moisture and chlorine equals 100%.
■ The net calorific value in kcal/kg is greater than the gross calorific value.
■ The conversion between kcal/kg and Btu/lb is incorrect.
■ A Dulong analysis of the as-given ultimate analysis yields 13,150 Btu/lb—nearly 1,000 Btu/lb greater than given.
■ The sulfur content of 3.3% is externally inconsistent for a Colombian coal; it should be less than 2%.
■ A typographical error invalidates the ash initial deformation temperature.
■ The ash hemispherical temperature is greater than the ash fluid temperature.
■ Minor error: The oxygen value does not have measurement units. ■
— Una Nowling, PE ([email protected]) is the technology lead for fuels at Black & Veatch. She has worked on fuels-related issues and analyses at more than 550 different units over 21 years, specializing in coal, natural gas, and biofuels. She is also an adjunct professor of mechanical engineering at University of Missouri-Kansas City.