Pressure-Sensing Line Problems and Solutions
Improper pressure-sensing line design or installation is often found to be the cause of poor sensing system accuracy and response time. Here’s how to identify and solve those pesky pressure sensor problems in short order.
Sensing lines (also referred to as impulse lines) are used to enable the location of pressure transmitters away from the process being measured so as to reduce the temperature effects on the transmitter’s performance and operating life. High ambient temperatures can affect a transmitter’s mechanical components and also shorten the life of its solid-state electronics. Locating a transmitter away from the process can also reduce the adverse effects of vibration and facilitate access to the transmitter for replacement or maintenance.
Figures 1 and 2 illustrate two different views of sensing lines. As these figures show, sensing lines connect a pressure transmitter to the process. Depending on the application, there may be one or two sensing lines for each transmitter. Both liquid-filled and gas-filled sensing lines are used in industrial processes. Liquid-sensing lines typically contain the process liquid or oil, depending on the sensing line’s design and application. Gas-sensing lines typically contain steam, air, nitrogen, or other gases, and there is sometimes a transition in sensing lines to another medium, such as oil or water. A diaphragm, bellows, or condensate pot is used in the sensing line for the transition from one medium to another.
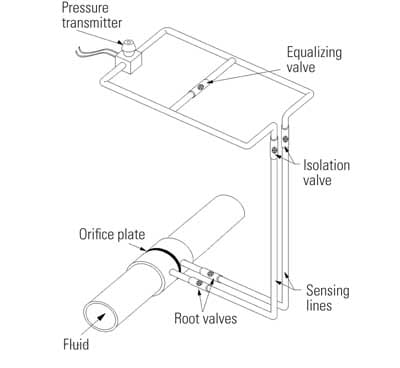
1. Get it right the first time. Example of a proper pressure transmitter installation. Source: Analysis and Measurement Services Corp.
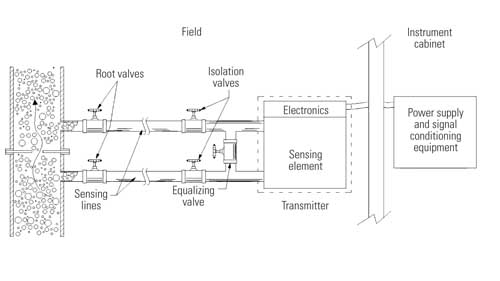
2. Isolation valves required. The typical pressure-sensing system design uses a combination of isolation valves. Source: Analysis and Measurement Services Corp.
Sensing lines are typically made of small-diameter (on the order of 1.5 cm to 2 cm) stainless steel, carbon steel, or copper tubing in thicknesses of about 2 mm. Tubing is preferred over piping because it can be installed in one piece, reducing the possibility of leaks.
Sensing lines vary in length, depending on the application. They can be as short as a few meters or as long as 200 or 300 meters, and average 10 to 50 meters. Because the length of sensing lines affects the overall response time of a pressure-sensing system, attempts are often made to make sensing lines as short as possible.
Sensing line installations are usually designed to allow for the lines’ thermal expansion and vibration without deformation, to ensure drainage by gravity, and to allow the lines to vent themselves. For liquid-sensing lines, self-venting is accomplished by sloping the sensing line downward so that any gas or air in the line can vent to the process. The slope of a sensing line might be about 10 cm per meter. If the sensing line cannot be sloped, a high-point vent must be provided for liquid-sensing lines and a low-point vent must be provided for gas-sensing lines.
Sensing Line Problems
Sensing lines may encounter a number of problems that can affect the accuracy and response time of the pressure-sensing system. Discussions of the typical problems found in power plants follow.
Reference leg boil-off. The example in Figure 3 shows how a reference leg boil-off can cause sensing line problems. In the figure, a differential-pressure transmitter is being used to measure the fluid level in a vessel containing water at the bottom and steam at the top. Normally, the transmitter is calibrated with the assumption that the reference leg is filled with a water column of known height. The condensate pot helps ensure that this assumption is satisfied by condensing the steam into water at a known point in the system. During certain plant transients or accident conditions, the ambient temperature may increase, and pressure may decrease until it causes the water in the reference leg to flash to steam. This causes the level information to lose accuracy. One remedy is to use isolation diaphragms or isolation bellows in the sensing lines (Figure 4).
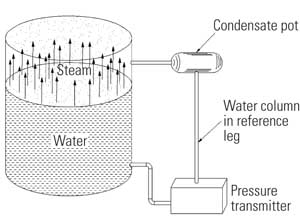
3. Steamy scene. Level measurement instrumentation must include a condensate pot if steam is present. Source: Analysis and Measurement Services Corp.
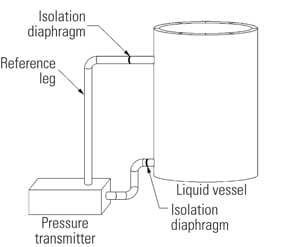
4. Isolated systems. Liquid-level measurement requires isolation diaphragms in the sensing lines. Source: Analysis and Measurement Services Corp.
Level measurement problems. Level measurement problems can occur when noncondensable gases become dissolved in the reference leg of sensing lines. Experience has shown that the dissolved gases may reappear during a rapid depressurization of the process below a certain pressure. More specifically, dissolved gases that accumulate over time during normal operation can rapidly come out of solution and displace water from the reference leg. This reduces the reference leg level and results in an erroneously high level indication.
Voids, blockages, leaks, and freezing. Voids, blockages, leaks, or freezing in sensing lines can cause errors in pressure measurements and can also affect the dynamic response of the pressure-sensing system. Although sensing lines are usually designed to avoid these problems, they still occur in industrial processes:
-
Voids. Air or gas entrapped in liquid-sensing lines can cause false pressure readings, sluggish response, and extraneous noise as a result of acoustic resonances. For example, in differential-pressure measurements, an air pocket on the low-pressure side can cause the pressure indication to be higher than normal. It can also add a delay in the transmission of the pressure information. Purging air from voids is difficult. Though one would expect air pockets to dissolve in the liquid under the high pressures common in industrial pressure measurements, the problem of voids persists.
-
Blockages. Blockages occur in sensing lines when the chemicals that are used to treat the water and sludge solidify or when other contaminants accumulate. They also occur due to obstructions caused by isolation and equalizing valves that are improperly aligned or seated or due to sensing lines becoming crimped. A partial blockage is detrimental only to the dynamic response time of the pressure-sensing system and does not normally affect the static output of the transmitter. But when the blockage completely blocks the line, the pressure information is totally lost.
-
Leakage. Pressure-sensing lines provide many opportunities for leakage to occur. A sensing line may have a root valve, one or more isolation valves, an equalizing valve, or other connections that can give rise to leaks, especially under high working pressures. Any significant leakage or loss of fluid in a sensing line can cause a false pressure indication.
-
Freezing. In cold weather, freezing can occur in fluid sensing lines if the sensing line’s heat tracing, which is used to prevent freezing of the fluid, is aged or damaged. This problem can go undetected if the freezing causes a normal operating pressure to be locked into the system.
Common Sensing Lines
Redundant pressure transmitters in some processes sometimes share a sensing line. The problem with common sensing lines is that they can cause a common mode failure if there is a leak, blockage, or void in the common leg.
In addition to common mode problems, the dynamic response times of a group of pressure transmitters that share a sensing line may be dominated by the response time of the most compliant transmitter on the common leg. The most compliant transmitter in most cases could be the slowest-responding transmitter. This could cause all transmitters on the common sensing line to be as slow as the most compliant transmitter.
Noise from Sensing Lines
Noise arises in sensing lines because of process fluctuations, vibration in the sensing line, acoustic resonances, steam line resonances, control system malfunctions, and resonances caused by undissolved air pockets in liquid-filled sensing lines. To reduce the effect of noise, mechanical snubbers are sometimes used in pressure-sensing lines. Snubbers reduce the effect of noise by increasing the dynamic response time of the pressure-sensing system. Therefore, they must be used cautiously in those cases where response time is important.
An alternative to snubbers is electronic low-pass filters with adjustable response times. These filters can provide any level of noise reduction; however, like snubbers, they increase the system’s response time. One advantage of electronic filters is that they remove not only any mechanical or acoustic noise in the system but also any electrical noise. Another advantage is that they can be designed to have a precise roll-off frequency.
The disadvantage of electronic filters is that, unlike snubbers, they do not protect the sensing element of the pressure transmitter from mechanical fatigue caused by the excessive high-frequency vibration that process pressure fluctuations impose.
Sensing Lines’ Effect on Pressure Transmitters’ Response Time
The response time of a liquid-filled sensing line has two major components: a sonic delay and a hydraulic delay. The sonic delay corresponds to the time that it takes for the pressure signal to travel at the speed of sound through a completely filled (solid) sensing line from the process to the transmitter. A water-filled sensing line of about 30 meters has about 21 milliseconds of sonic delay. The sonic delay is also referred to as acoustic delay.
The hydraulic delay in a sensing line depends mainly on the volume of fluid that must move in the sensing line in order to bring a pressure change from the process to the transmitter. Figure 5 shows a sensing line leading to a pressure transmitter that has a sensing element that must move a portion or all of the distance x in order to indicate the applied pressure. The distance x traveled by the sensing element depends on the pressure transmitter’s design.

5. Easy calculation. Transmitter compliance is determined by the physical installation of the component and its volume. Source: Analysis and Measurement Services Corp.
In some pressure transmitters, such as some manufactured by Rosemount, the sensing element is a diaphragm that moves very little to indicate the applied pressure. In other transmitters, such as some manufactured by Barton, the sensing element is a bellows that must move an appreciable amount to indicate the applied pressure. The movement of the sensing element requires a corresponding movement of the fluid in the sensing line. Therefore, the longer the sensing line, the more time is required for the fluid to move the required distance and also overcome the additional resistance to flow.
The distance x was used to illustrate the relationship between sensing line delays and a pressure transmitter’s design characteristics. In reality, however, the controlling factor in a sensing line’s hydraulic delay is the volume change inside the transmitter, not the distance x.
Another controlling factor is the pressure that is required to induce the volume change. The parameter that combines these two factors is the transmitter compliance, which is defined as the ratio of the transmitter volume change to the pressure change that is required to attain the volume change. Transmitter compliance is a characteristic parameter of a transmitter that should be specified by the manufacturer.
Table 1 shows the compliances of three different pressure transmitters. For the transmitter with a larger compliance, a larger volume of fluid must move through the sensing line in order to indicate a given pressure change. For such transmitters, the response time of the overall pressure-sensing system from the process to the transmitter output is a strong function of the sensing line’s length and diameter.
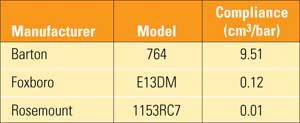
Table 1. Examples of compliance values for representative pressure transmitters. Source: Analysis and Measurement Services Corp.
Furthermore, the response time of transmitters with larger compliances is more significantly affected by any void or obstruction in the sensing line. Figure 6 shows how the response times of representative pressure transmitters are increased as a function of sensing line blockages. This data was obtained in laboratory experiments in which a snubber (Figure 7) was used to simulate sensing line blockages for the tests. It is understood that the snubber may not correctly simulate the effect of a real blockage in a pressure-sensing line. As such, the data in Figure 6 only serves as an illustration of the effect of sensing line blockage on transmitter response time.
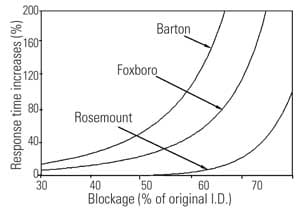
6. Different responses. The response time differences between different transmitter designs with a sensing line blockage can be profound. This figure is based on laboratory test data. Source: Analysis and Measurement Services Corp.
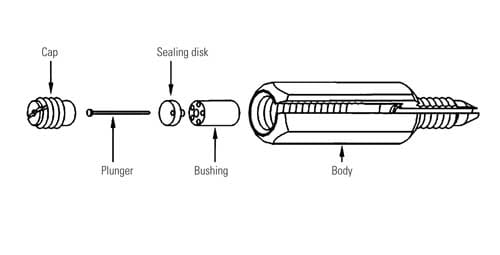
7. Give a blockage the cold shoulder. Snubbers are used to simulate sensing line blockages. Source: Analysis and Measurement Services Corp.
It is obvious from the data in Figure 6 that different transmitters are affected differently by blockages, depending on their compliance value. For example, the response time of the Barton transmitter shown in Figure 6 increases by almost 200% when the blockage advances to near 65% of the diameter, while the response time of the Rosemount transmitter increases by only about 10% for the same amount of blockage.
Figure 8 shows power spectral densities (PSDs) for a pressure-sensing system that was tested in a laboratory experimental setup with and without air in the sensing line. The effect of the void in the sensing line is manifested by a resonance on the PSD and a lower break frequency. At this lower break frequency the PSD roll-off begins measuring that the transmitter’s response time is larger with the void in the system.
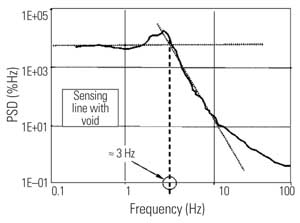
8. Sensing an air leak. The power spectral density (PSD) for a pressure-sensing system can identify air leakage in a sensing line. Source: Analysis and Measurement Services Corp.
Figure 9 compares two PSDs for a pressure transmitter tested in a power plant before and after the sensing line was cleared of a blockage. Clearly, the blockage in this case increased the transmitter’s response time by at least an order of magnitude.

9. Line blockages also sensed. The power spectral density (PSD) from online testing of a Barton transmitter can identify a sensing line blockage. Source: Analysis and Measurement Services Corp.
Validation of Noise Analysis Technique for Online Detection of Sensing Line Problems
The validity of the noise analysis technique for online detection of sensing line blockages has been established by numerous laboratory and in-plant demonstration tests involving a variety of pressure transmitters. (See H.M. Hashemian, "Long-Term Performance and Aging Characteristics of Nuclear Plant Pressure Transmitters," U.S. Nuclear Regulatory Commission, NUREG/CR-5851 [March 1993]). Table 2 shows representative results of such tests that involved a Barton pressure transmitter. The transmitter was tested alone, then with 30 meters of sensing line tubing, and finally with a snubber in the sensing line. In each case, the response time of the transmitter and the attached sensing line was measured by the conventional ramp method and by the noise analysis technique. The noise was generated for this experiment in a laboratory test loop that was designed to simulate process fluctuations for research purposes.
As shown by these results, the noise analysis technique identifies the response time of the transmitter and its sensing line with good accuracy and accounts for the effect of sensing line length and the blockage (simulated by the snubbers) on the response time.
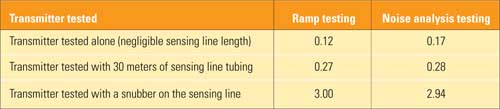
Table 2. Representative results of validation of noise analysis technique for response time testing of pressure transmitters and associated sensing lines. Source: Analysis and Measurement Services Corp.
Solving Sensing-Line Problems
Remedies that remove voids and/or blockages in sensing lines are to periodically blow down, back fill, or drain the sensing lines.
Another solution is to test or monitor for the presence of voids or blockages in the sensing lines online. This can be done by using the noise analysis technique for in-situ testing of pressure transmitters’ response times described earlier. In fact, one of the main advantages of response time testing with the noise analysis technique is that its results will include the effects of sensing lines. That is, any response time result for pressure transmitters that is obtained by the noise analysis technique will inherently account for the length and diameter of sensing lines as well as for any blockages, voids, leaks, or freezing that may be present in the sensing lines.
—H.M. Hashemian (hash@ams-corp .com) is president and CEO of Analysis and Measurement Services Corp. Dr. Jin Jiang ([email protected]) is a professor of electrical and computer engineering at the University of Western Ontario.