Predictive Maintenance That Works
This is the fourth in a series of predictive maintenance (PdM) articles that began in the April “Focus on O&M” with an introduction to PdM as a process whereby maintenance is performed based on the condition of the equipment rather than on a predetermined interval. In the May and July issues, we began exploring specific PdM techniques, such as motor-current signature analysis and oil analysis.
Thermographic Analysis
Thermographic analysis is a nondestructive testing (NDT) technique that uses infrared (IR) scanners, similar in appearance to video cameras, to detect differences in surface temperatures and to highlight those differences in color images that are displayed on a video screen. These images can be photographed with conventional films or digitally recorded, and the images, called thermograms, are used to analyze patterns of heat gain or loss.
Many plants restrict their IR work to electrical systems, to identify poor electrical contacts or connections (Figure 4). But top-notch facilities go beyond that, heavily relying on IR to inspect mechanical systems too. Thermography can identify such mechanical problems as hot bearings, thermal-insulation breakdown, refractory deterioration, and leaking steam traps. Nuclear stations, for example, shoot thermographic images of primary-coolant relief-valve stacks to identify leaking valves.
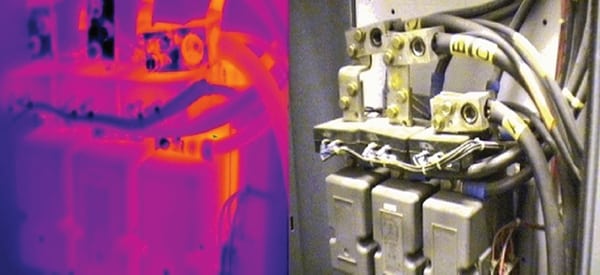 |
| 4. Identify pending failures. This step-down transformer powering the cooling tower of Lawrence Energy Center’s Unit 5 was on the verge of a catastrophic failure that would have shut down the entire plant a few years ago. A thermographic inspection diagnosed the problem as a broken or loose rotor bar. Repairs were completed before the transformer failed. Courtesy: Westar Energy |
Prior to thermography surveying, plants had to remove all relief valves and send them to a laboratory to be pop-tested. Now they only have to pop-test 20% of them to meet Nuclear Regulatory Commission requirements. Another example of thermography’s application to mechanical problems: An IR survey helped one plant identify a blocked cooling passage in a shell-and-tube heat exchanger, allowing staff to repair the component, rather than replace the entire heat exchanger, as previously planned. In this case, the IR survey saved $100,000 by avoiding the heat exchanger replacement.
IR scanning is nondestructive, and it can be performed at a distance from machinery that is difficult or awkward to reach. Because surveys are best done while the equipment is in operation, there is no need for machine downtime and lost production. In addition to helping avoid costly or even catastrophic equipment failures, thermographic analysis can be used to help prioritize repairs prior to outages, to evaluate completed repair work, and to check new installations prior to startup.
Spot checking is used primarily when maintenance or operations staff suspect that a problem exists, or prior to planned maintenance to identify developing problems and prioritize the work. One advantage of thermographic analysis of electrical equipment is that the scan provides an immediate and quantifiable indication of the temperature difference between a properly functioning circuit or connection, and one that is overheating. This means that the technician can often determine the seriousness of the electrical problem without having to review historical patterns or past analyses. This quantitative analysis can also be helpful in determining how long the equipment can continue to operate before there is a catastrophic failure.
Routine PdM Requirement
Additional information can be obtained by performing thermographic analysis on a periodic basis, for example once a year, or after each major overhaul or plant outage. Periodic thermographic analysis can provide a more subtle indication of electrical deterioration, bearing or coupling wear, roof deterioration or leakage, and refractory cracking. This can allow plant staff to project acceptable performance for the coming six months or one year. Advance notice of developing problems means that they can be resolved or repaired during normal shutdowns, rather than allowing a catastrophic failure to occur. Because problems are detected when they are relatively minor, they are usually much less expensive to repair.
One difficulty with IR surveys is documenting the results. Data typically are stored today in digital form or in photographs, neither of which clearly and conveniently depicts the overall situation to work planners and upper management. To remedy this, some specialists generate thermal maps, which depict temperatures throughout the unit and color-code problem areas. The thermal map shows elevation levels and the location of recognizable components such as buckstays and manways.
IR scanners can only measure the temperature of visible, radiating surfaces, which means they cannot take readings through glass or metal housings or covers, unless the metal covering is thin enough for secondary heat patterns to appear. Readings are also affected by the reflective nature of the surface being measured, and this reflectivity value must be taken into account when scanning different objects or surface materials. The equipment cost is moderate to expensive, particularly when many of the more sophisticated options are included.
IR scanners vary in their accuracy, sensitivity, temperature range, resolution, and portability. Options include a variety of graphic displays, video/audio capabilities, zoom, interchangeable lenses, battery operation, data logger/printer, image storage, and digital outputs.
Scanner operation is relatively easy; however, interpretation of the scanned images requires a moderate amount of training and experience. Training and certification can be obtained from either the scanner manufacturer or one of several independent certification companies. For companies with limited budgets, there are service companies that will perform thermographic analysis on a contract basis.
More Coming
In the next segment of “Predictive Maintenance That Works,” we’ll continue our discussion of specific NDT-related condition-monitoring techniques used at power plants and why each should be a part of your PdM program.
—Dr. Robert Peltier, PE is POWER’s editor-in-chief.