Low-Cost Wireless Sensors Can Improve Monitoring in Fossil-Fueled Power Plants
As equipment ages in fossil-fueled power plants, component wear leading to machinery failure increases as a result. Extending equipment life requires increased attention to maintenance, and one way to improve maintenance planning is to detect faults prior to failure so maintenance can be scheduled at the most cost-effective, opportune time. This type of strategy benefits from the use of additional sensors, and wireless ones can often be installed with the least time and cost.
For many years the normal practice in power plants and other process industry facilities has been to hardwire important sensors from their location in the plant to a central equipment room, where monitoring systems are installed to collect data from the sensors. This arrangement worked well, but the cost of installing all the wiring to connect each sensor to the central location was quite high, often many times more than the cost of the sensor itself. The high cost of sensor installation has discouraged companies from installing all the desired sensors to fully monitor their plants.
In the past few years a new class of wireless sensors has been developed that features a standard physical communication layer, a self-forming mesh network, and low enough power usage to enable battery life of a year or more. These new wireless sensors have the potential in the next few years to dramatically change not only the wireless sensor landscape but also the process-monitoring landscape. Consequently, exploring the potential of wireless sensors for monitoring power plants has become important.
Before any new technology can be accepted by the electric power industry it must be tested in a realistic power plant environment. This article describes a low-cost wireless sensor testing in the coal-fired E.C. Gaston Electric Generating Plant, which is located in Wilsonville, Alabama. Two different sets of tests were conducted by Southern Co. and the University of North Carolina at Charlotte. The focus of the first phase was on the wireless communication and battery life. The second phase involved development of practical monitoring solutions using the low-cost wireless sensor nodes.
Equipment Description
The equipment tested was purchased from Crossbow Inc. and initially consisted of two wireless sensor network development kits and two additional input/output (I/O) boards, which provided low-level analog input capability. Each kit contained six motes (sensor nodes), each with a multifunction sensor board, a base station with a USB port, a spare mote, and software. Later, two additional network gateways were purchased to enable diverse sensor testing.
The wireless mote has a low-power microcontroller with 128 kb of program flash memory and 512 kb of measurement flash memory. The radio operates at 2.4 GHz and has a maximum transmission power of 3 dBm. The mote runs an operating system that is based on the open source TinyOS operating system. It operates on very low power and has a sleep mode that draws only 8 µA. It has an on-board 10-bit analog-to-digital converter and a 51-pin I/O expansion connector. This connector is where sensor boards are attached. The mote is powered by two AA alkaline batteries.
Phase 1: Mote Testing
The focus of the plant environment testing was to determine how well the sensors communicated in the relatively unfriendly radio environment of a power plant. The goal was to provide guidance for someone deploying a wireless sensor network in a plant on the allowable distance between sensors and what to expect for battery life.
The general arrangement of the wireless sensor network during testing is shown in Figure 1. Only four motes are shown, but more motes were actually tested. The wall of the control room in which the base station was located is made of sheet metal, so to ensure good communication through the wall, one mote was positioned just outside the control room. The bulk of the remaining motes were at least 100 feet away under the Unit 5 turbine.

1. The power of networking: This was the general arrangement of the wireless sensor network during plant tests. Courtesy: Southern Co.
The computer communicates with the gateway in one of three ways over an Ethernet network:
-
The gateway has a built-in web server, so a web browser in the computer can log in to the gateway and view both sensor and network data.
-
A connection also can be made using a secure shell (ssh) program on the computer.
-
The disk drive on the gateway can be attached as a network drive (using Samba on the gateway) to the computer for sharing data files.
Mote Communication Testing
Twelve motes were distributed around the area under the Unit 5 turbine. This area has many large steam pipes and structural steel elements that have the potential to obstruct the radio signals from the wireless sensors. In most cases, there was no clear line of sight between motes. Because the test was planned to last only a couple of months, the motes were placed in plastic Zipock bags to protect them from dust and water (Figure 2).
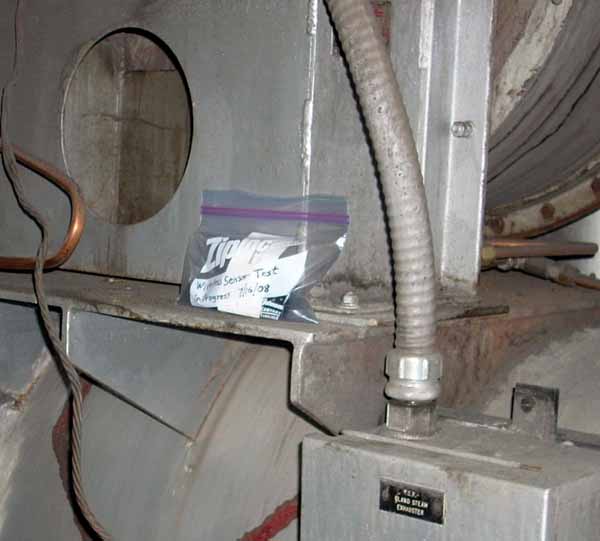
2. On location. Because the test was planned to last only a couple of months, the motes positioned on plant equipment for wireless sensor network testing were placed in plastic Ziplock bags to protect them from dust and water. Courtesy: Southern Co.
The wireless sensor network equipment was powered up, and within about 15 minutes most of the motes were communicating with the base station. A mesh network was established, and all but two motes were able to communicate with the base station either directly or through the mesh. When the two noncommunicating motes were relocated slightly, they began communicating. The motes were left in these locations for several weeks. Sensor data and mesh network performance data were recorded continuously during that time.
Battery Life
A key objective of this study was to learn more about typical battery life of the wireless motes. The short-duration office testing results indicated a battery life of about three months when the update rate was 3 minutes and the minimum operating voltage was assumed to be 2.0 volts. The battery voltage decay rate in the plant varied throughout the test. To determine the operating life of the motes using battery voltage one must know the minimum voltage at which a mote will operate. This probably depends somewhat on the type of mote and the type of sensor board.
In one instance during the demonstration there was a sudden change in the voltage decay rate. The cause of the sudden change in voltage decay rate was never determined. Analysis of the mesh network health data indicated that the network configuration changed at the same time the voltage decay rate changed. The number of message retries began increasing at that time, also indicating the presence of some interference. It is interesting to note that the mesh network maintained communication during this period despite the suspected interference.
Thermocouple Temperature Measurement
Two motes were configured with a low-level analog input data acquisition sensor board to enable thermocouple temperature measurements. These motes were placed in the plant with two thermocouples connected to each mote. The thermocouple measurement system worked well in the plant. One of the thermocouple motes was placed in a very hot location, and it survived ambient temperatures up 134F.
Mesh Network Monitoring
The mesh network software provided by the vendor provides the ability to monitor the mesh network performance and log the results to a file. One use for this functionality is to determine when the network connectivity or transmission quality changes. Two of the many parameters that are logged by this function are the number of messages forwarded by a node and the number of times a node retries to send a message. If the network configuration never changed and the transmission quality did not change, then the number of messages forwarded by each node would increase linearly over time.
If the mesh connectivity changes, then some nodes may forward more or fewer messages than in the original configuration. Similarly, if the transmission quality degrades, it may be necessary for a node to try several times to send a message before achieving a successful transmission. The multiple retries increase the overall network traffic and therefore the number of forwarded messages as well. Figure 3 shows one particular node that was on the edge of the mesh and farthest from the base station. It is clear that a disruption of communication occurred on August 29.
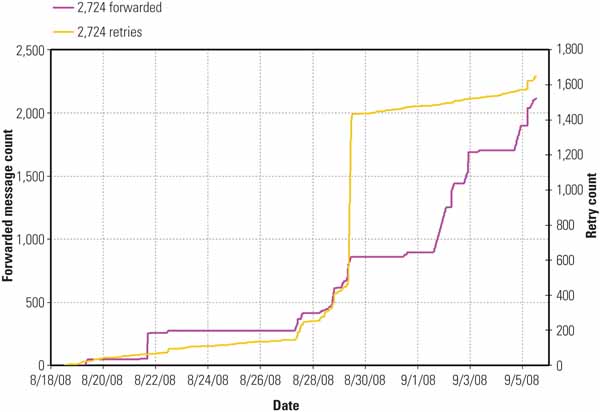
3. Living on the edge. The one particular node whose data are presented here was on the edge of the mesh and was farthest from the base station. It is clear that a disruption of communication occurred on August 29. Courtesy: Southern Co.
Mote Radio Range Testing
In an effort to determine the maximum transmission range of the wireless motes in a plant environment, a mote was moved around the plant while its communication to a base mote was verified. The base mote was located just outside the control room, as shown by the yellow star on Figure 4. The other mote was moved to the locations marked by the yellow and red circles. At each location communication with the base mote was checked. All the locations in this test were on the same level, elevation 424 feet. The radio power was tested at its maximum of 3 dBm (2 MW) and again at 0 dBm (1 MW). The movable mote successfully communicated with the base mote from all the locations shown by the yellow circles but did not communicate at the locations shown by red circles. It is clear that the radio signals can not communicate around the large boiler furnace obstruction.
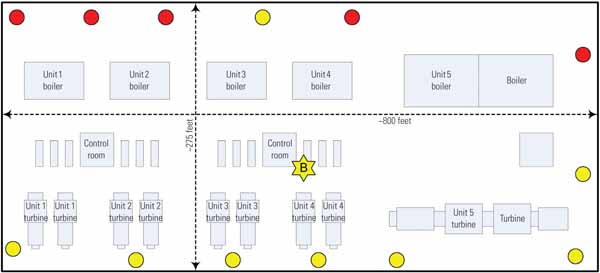
4. Can you hear me now? This diagram shows the testing locations used to determine the range of wireless motes. Red circles indicate no communication with the base mote (the yellow B); yellow circles indicate successful communication with the base. Courtesy: Southern Co.
Phase 2: Development and Testing of Monitoring Applications
Researchers from the University of North Carolina at Charlotte developed and tested a wireless mesh sensor network at the Gaston plant to perform some specific monitoring functions. The deployed wireless mesh sensor network (WMSN) included temperature-sensing nodes and vibration-sensing nodes. Although there are many potential uses for the two types of wireless sensor nodes developed for this project, two specific applications were highlighted for demonstration purposes: feedwater heater emergency drain valve monitioring and condition monitoring for boiler feed pumps.
Application 1: Feedwater Heater Emergency Drain Valve Monitoring. One issue affecting thermal performance in steam plants is valve leakage. One possible way to detect such leaks is to measure the temperature on both sides of the valve. If a leak occurs, the two temperature readings will begin to approach each other. If the valve is properly seated, the temperature on the downstream side should remain much lower than the upstream temperature.
Application 2: Condition Monitoring for Boiler Feed Pumps. Failures in boiler feed pumps and other critical rotating machines are extremely problematic in any power plant. A shutdown can be costly, particularly if it means that the entire unit must be shut down. The most common components to fail in any rotating-machine application are the bearings. For that reason, the project team constructed nodes that could be used to monitor the condition of the fluid bearings on all three components of the pump-motor-drive combination.
When monitoring bearing condition, both temperature and vibration measurements are very useful. To monitor boiler feed pumps at Gaston, the researchers designed a monitoring application that used a combination of thermocouple nodes and vibration plus sound-sensing nodes. Thermocouple nodes were deployed on both the lube oil piping for the various fluid bearings as well as on the bearings themselves.
Two types of vibration nodes were designed. The Type-1 vibration nodes were designed using the accelerometer in the integrated sensor board. Because the sensor board needs to be directly attached to the mote, these nodes must be physically attached to the surface where the vibration is to be measured. The Type-1 vibration nodes were also programmed to measure average sound intensity at the location using an on-board microphone. Because the physical size of the node enclosure precludes its use for measuring vibrations in hard-to-reach locations, a Type-2 vibration node was also designed that used a small external vibration probe attached to the node enclosure by a 6-foot cable.
The Type-1 vibration- and sound-sensing node determines the intensities of vibration and sound signals as perceived from a set of rapidly taken samples. The vibration intensity is obtained by computing the standard deviation of 20 consecutive samples of the x-axis accelerometer output that were obtained at 25-ms intervals, an effective sampling rate of 40 Hz.
The sound intensity was obtained by applying a slightly modified process to the microphone signal. In this case, the sampling interval was set to 50 ms, a rate that was experimentally determined to generate the best results. Furthermore, in order to allow the sound amplifiers to stabilize after each turn-on, the first 5 seconds of recorded data were discarded during each measurement period.
The Type-2 vibration-sensing node was designed using an external vibration probe with a magnetic holder that could be attached to locations where the Type-1 vibration-sensing node enclosure would not fit (Figure 5).
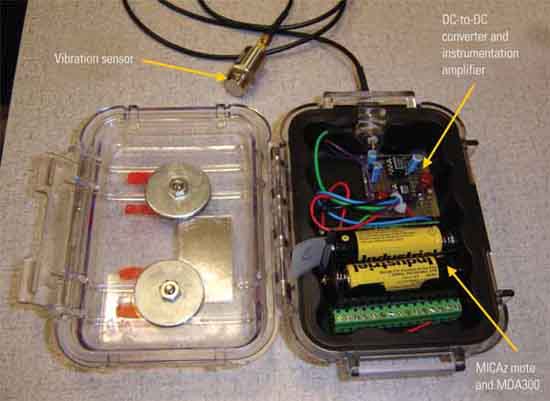
5. Vibration sleuth. The Type-2 vibration sensor is equipped with an external sensor, a custom sensor interface board, and a high-speed sampling mote. Courtesy: Southern Co.
This node was equipped with the following components:
-
External vibration sensor. An external piezoelectric device originally used with a commercial, handheld vibration meter.
-
Custom sensor interface board. Piezoelectric sensors are high-impedance devices, and they must be interfaced with signal-conditioning circuits that have high input impedance. A custom interface board was designed to match the high impedance of the sensor and transform the vibration signal to appropriate voltage variations for the data acquisition board.
-
High-speed sampling mote. The data acquisition board performed two functions. First, it was used to generate the DC power to activate the interface board at intervals of 15 minutes, when vibration samples were taken. Second, during the sampling period, it obtained 20 samples at intervals of 50 ms for obtaining the vibration intensity.
Deployment
A wireless mesh sensor network consisting of 20 wireless nodes and a base station was deployed at the Gaston plant to perform the targeted monitoring applications. All nodes were programmed to transmit data to the base station at 15-minute intervals. The route update was also set for 15-minute intervals.
Successful Demonstration of Wireless Sensors’ Capabilities
As stated earlier, two sets of low-cost, battery-powered wireless sensors using the IEEE 802.15.4 radios were tested in the fossil power plant demonstration. The first set was off-the-shelf commercial motes that were tested to determine their communication capabilities and battery life. The second set of sensors was based on off-the-shelf commercial motes but had custom software and packaging. The second set was designed for specific monitoring applications on plant components for maintenance purposes.
The communication capabilities were surprisingly good in the test. Even in the heavily congested area under a steam turbine the motes were able to communicate effectively. The mesh network that is part of the IEEE 802.15.4 standard provides multiple potential paths for communication. There were occasions during the test, which lasted several months, when the network altered its configuration, apparently to maintain communication in the face of some disturbance in the radio environment around the motes — a useful feature of mesh networking. The flexibility of the mesh network appears to be an important characteristic when using the low-power radios dictated by battery-operated motes.
A radio frequency site survey was done in the plant before the wireless sensors were installed for testing. The results of the site survey indicated that no other communication sources in the ISM (industrial, scientific, and medical) frequency bands were present. An intermittent broadband noise source was detected, but the source was not identified, and the noise did not appear to interfere with the wireless sensor network.
Battery life of wireless sensors (in this case, motes) is difficult to predict definitively because it depends on the radio environment, which is susceptible to changes in the plant and dependant on the configuration of the network. With two AA alkaline batteries and a data update period of 3-minute intervals, battery life varied from about two months to six months on the first set of motes. On the second set of motes, in which the data update rate was 15 minutes, the projected battery life was about five to six months. These motes were doing more rapid sampling and some on-board processing of the data, which tended to counteract the benefit of the slower update rate. The use of larger batteries such as D cells would increase battery life by approximately five times, and lithium ion batteries would make a further improvement.
The sensors performed well in several different applications, including these:
-
Two of the wireless motes were configured to measure temperature using thermocouples. This worked well, with no noticeable noise problems from the low-level analog input system. The thermocouple inputs did not appear to affect battery life compared to that of the motes using a different sensor board.
-
Two types of vibration-monitoring motes were developed and tested on a boiler feed pump system. The vibration measurements clearly showed when the equipment was operating.
The Gaston power plant demonstration was a success. Observations from these tests provided valuable insights into the potential of using 2.4 GHz 802.15.4 radio-based low-cost wireless sensor networks for power plant monitoring.
—Cyrus W. Taft, PE (cwtaft@ taftengineering.com) works for Taft Engineering Inc., in Harriman, Tenn. Aaron J. Hussey ([email protected]) works for Electric Power Research Institute in Charlotte, N.C. Teja Kuruganti (kurugatipv@ornl .gov) works for Oak Ridge National Laboratory in Oak Ridge, Tenn. John N. Sorge, PE ([email protected]) works for Southern Company Services Inc. in Birmingham, Ala. Asis Nasipuri (anasipur@ uncc.edu) works for the University of North Carolina at Charlotte.