Linden Generating Station, Linden, New Jersey
In the late 1990s, Public Service Enterprise Group Inc. (PSEG, based in Newark, N.J.)—like just about every other U.S. investor-owned utility—was trying to determine where in the world electricity demand would be growing fastest. To profit from serving that demand, PSEG (again, like other utilities) spun off an independent arm—PSEG Global, whose executives decided that the best growth strategy would be to build natural gas–fired combined-cycle plants in key load pockets across the U.S. At that time, the industry wasn’t particularly interested in constructing nuclear or coal plants. In the case of coal, the cost/kW was significantly higher than that for gas-fired combined-cycle plants.
PSEG began by doing load projections for its normal strategic planning horizon (2008) both inside of its native service territory—the bulk of New Jersey—as well as elsewhere. Initial analyses suggested that the company would be best positioned to make a profit by building plants at specific sites in Texas, Ohio, Indiana, New York, and New Jersey. As part of the selection process, PSEG Global closely examined each potential site’s "infrastructure logistics"—the extent to which fuel, water, and transmission were available or could be acquired.
Around that time, two events changed PSEG’s resource planning calculus: the birth of the Pennsylvania-New Jersey-Maryland (PJM) Interconnection in 1998 and passage of the New Jersey deregulation law in 1999. The creation of PJM—to serve as the wholesale power market and grid operator for 51 million people in 13 eastern states and the District of Columbia—immediately increased the profit potential of any new plant in its region. The imminent deregulation of New Jersey’s retail electricity market made building a new plant in PSEG’s native territory a better bet because retail choice would serve to spur demand, which had stagnated there.
The resource planning models that PSEG used during its benchmark evaluations had a 10-year horizon in PSEG’s native territory and a horizon similar to that in its nonnative territory. The models were based on archival data going back 20 years as well as on "informed speculation" about growth over the next decade.
Where the money went
At the end of the day, PSEG decided to proceed with the simultaneous development of the following six combined-cycle projects, with virtually identical equipment (with the exception of their heat-recovery steam generators) and projected start-up dates within one year of each another:
- Guadalupe and Odessa—two identical 1,000-MW, 4 x 2 plants in Santa Clara and Odessa, Texas.
- Bergen 2—a 500-MW, 2 x 1 plant in Ridgefield, N.J.
- Lawrenceburg—a 1,150-MW, 4 x 2 plant in Dearborn County, Ind.
- Waterford—an 850-MW, 3 x 1 plant in Washington County, Ohio.
- Bethlehem Energy Center—a 750-MW, 3 x 1 plant just south of Albany, N.Y. (see Bethlehem Energy Center).
- Linden Generating Station (Figure 1)—a 1,240-MW 4 x 2 plant in Linden, N.J., and the subject of this Top Plant profile.
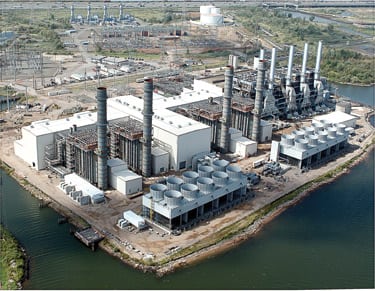
1. Well worth the wait. The two-unit Linden Generating Station in New Jersey has a rated capacity of 1,240 MW at 94F. But when firing fuel in the winter, each unit can push 700 MW. You can clearly see from the perpendicular white buildings (the power blocks) in this aerial shot that one of the plant’s steam turbines is well off the centerline of the gas turbines. Also note the old steam plant (at right) and the limited site footprint. Courtesy: PSEG Power
All six projects—with the exception of Bethlehem Energy Center, which was designed by Sargent & Lundy, and Linden, where the contract called only for engineering and construction—were to be (and eventually were) designed and built by the same engineering/procurement/construction (EPC) contractor: the now-defunct Duke/Fluor Daniel. PSEG Global—and the ad hoc subsidiaries set up to own and operate the plants—expected some synergies from using the same EPC and the same gas turbines (GE 7FAs) and steam turbines (GE D11s) for all six plants. In fact, one of the company’s goals was to have the plants look and smell and act alike as much as possible. But once the EPC signed on the dotted line, the driver of each project’s construction schedule became local market demand.
Because demand in Texas was as robust as PSEG anticipated, the Guadalupe and Odessa plants were built on schedule and came on-line in fall 2000 and late spring 2001, respectively. Next came Bergen 2 (representing the first expansion in PSEG’s native territory), which went on-line in the summer of 2002. Then came the concurrent groundbreakings for the Lawrenceburg and Waterford plants, which were scheduled to come on-line at about the same time.
Clouds gather
At that point, events conspired to derail PSEG’s ambitious development plan, forcing the utility to begin staggering the project start-up dates. The commercial debuts of Lawrenceburg and Waterford were pushed back one year to 2004 because growth in the Indiana and Ohio load pockets was lower than anticipated. Construction of the Bethlehem Energy Center was slowed down for the same reason. And Linden’s start-up had to be pushed back—several times—because natural gas prices had gone through the roof and the cost to raise capital had risen. The overall environment dictated that PSEG be more prudent about where it invested its money.
Yet continuing with the Linden plant made sense because of its superior infrastructure logistics. Because it was a brownfield site—hosting three oil-fired steam units with a total capacity of 436 MW—transmission lines, fuel lines, permits, and rights-of-way were already in place. An existing gas supply line and connections to the regional grid and to the native company made the site very "clean." Acquiring the necessary volume of cooling water was the only problem that would require a creative solution (see box).
The final benefit of continuing with the project: PSEG would get NOx credits for replacing the old Linden plant’s three 1950s/1960s-vintage units (with 14,000 Btu/kWh heat rates and terrible emissions profiles) with 7,200 Btu/kWh gas-fired units producing virtually zero emissions. The gas turbines’ dry, low-NOx 2.6 burners reduce emissions of the pollutant to 9 ppm, and a downstream selective catalytic reduction system with ammonia injection lowers them further, to 2 ppm.
Going gray is win-win
If there’s a larger power plant user of reclaimed water in the U.S. than Linden Generating Station, POWER would like to know who it is.
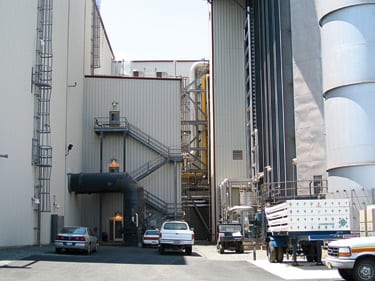
Linden gets all the cooling water it needs from the nearby Linden/Roselle Sewage Authority (LRSA). A series of pumps delivers LRSA’s effluent to a secondary treatment station 1 mile from the plant (Figure 2). There, following the addition of hypochlorite to kill selected biological organisms (removing the "human element" from the wastewater), the stream goes to sand filters that remove residual oil, grease, and suspended solids from LRSA’s product.

2. Cleaning up wastewater. At a secondary treatment facility 1 mile from the Linden plant (visible in the background), a biocide and sand filters work together to improve the quality of wastewater to meet the plant’s cooling water specs. Courtesy: PSEG Power
The reclaimed water then is pumped at 8,100 gpm through 24-in pipes running alongside the access road to the plant’s cooling tower basins. Once the water reaches the plant, a stream is split off, fed to the cooling towers, and conventionally treated in the basins.
PSEG had prior experience using gray water at its Bergen station. What distinguishes the system in use at Linden is primarily its high flow rate. However, another difference is the constitution of LRSA’s effluent. Linden has to make sure that the water it returns to LRSA is within the sewage plant’s tolerances for chloride and the like, or it will upset the facility’s delicate operating balance.
Why is Linden’s use of LRSA’s product a win-win situation? PSEG had no choice but to use reclaimed water, because water isn’t available anywhere on the site and because you can’t get a permit to drill a well in New Jersey. From LRSA’s point of view, the arrangement is even sweeter. Whatever reclaimed water the plant doesn’t consume is returned to LRSA cleaner than when it arrived—it is almost drinking-quality and thus permissible to discharge. LRSA stores the return stream in tanks so it can dilute its discharge even when the flow stops. But what LRSA likes best about the arrangement with Linden is that the plant pays LRSA for something that it otherwise would throw away.
Going gray is win-win
If there’s a larger power plant user of reclaimed water in the U.S. than Linden Generating Station, POWER would like to know who it is.
Linden gets all the cooling water it needs from the nearby Linden/Roselle Sewage Authority (LRSA). A series of pumps delivers LRSA’s effluent to a secondary treatment station 1 mile from the plant (Figure 2). There, following the addition of hypochlorite to kill selected biological organisms (removing the "human element" from the wastewater), the stream goes to sand filters that remove residual oil, grease, and suspended solids from LRSA’s product.
2. Cleaning up wastewater. At a secondary treatment facility 1 mile from the Linden plant (visible in the background), a biocide and sand filters work together to improve the quality of wastewater to meet the plant’s cooling water specs. Courtesy: PSEG Power
The reclaimed water then is pumped at 8,100 gpm through 24-in pipes running alongside the access road to the plant’s cooling tower basins. Once the water reaches the plant, a stream is split off, fed to the cooling towers, and conventionally treated in the basins.
PSEG had prior experience using gray water at its Bergen station. What distinguishes the system in use at Linden is primarily its high flow rate. However, another difference is the constitution of LRSA’s effluent. Linden has to make sure that the water it returns to LRSA is within the sewage plant’s tolerances for chloride and the like, or it will upset the facility’s delicate operating balance.
Why is Linden’s use of LRSA’s product a win-win situation? PSEG had no choice but to use reclaimed water, because water isn’t available anywhere on the site and because you can’t get a permit to drill a well in New Jersey. From LRSA’s point of view, the arrangement is even sweeter. Whatever reclaimed water the plant doesn’t consume is returned to LRSA cleaner than when it arrived—it is almost drinking-quality and thus permissible to discharge. LRSA stores the return stream in tanks so it can dilute its discharge even when the flow stops. But what LRSA likes best about the arrangement with Linden is that the plant pays LRSA for something that it otherwise would throw away.
Moving forward
One unusual aspect of the construction of the new Linden Generating Station was that Duke/Fluor Daniel played more of an engineering and construction management role than is typical on a turnkey power project. PSEG decided to do the lion’s share of the equipment procurement for Linden itself.
That was fine with Duke/Fluor Daniel because, at the time (like other EPCs), it had more work than it could accommodate. As a result, the firm was looking for ways to reduce its risk and yet keep its foot in the door of as many projects as possible. Taking the "P" out of EPC and allowing "PSEG native" to take overall responsibility for commissioning efforts at Linden did just that.
The reason that PSEG didn’t take on all three letters of "EPC" was that it didn’t have the bench strength of an E&C group. PSEG did, however, assemble its own, relatively robust E&C group in 2002/2003. The activities of this group then were interwoven with those of the EPC contractors for Linden and the other projects. This provided an additional level of detailed contract management and project oversight—including handling litigation, fast-tracking, and other balance-of-project tasks. The internal group only got significantly involved when a project got a little off-track or if its earn-to-burn curves were off.
PSEG partially demolished the old plant, to the extent required to build the new one. Only one of the three units of the old Linden plant had to be demolished to make room; the new Unit 1 now sits where the old Unit 3 was, and Units 1 and 2 of the old Linden station were "abandoned in place." PSEG also took out some transformers and explosion walls at the front of the property.
What makes Linden different
The Linden site, just east of the New Jersey Turnpike in an area replete with petrochemical plants, didn’t provide a lot a room for the repowering project. The back side of the property is the Arthur Kill, the body of water from which the old plant drew its makeup water. It’s only about 40 feet from the new plant’s cooling towers, water treatment plant, and demin water storage tanks to the banks of the Arthur Kill.
The compactness of the site necessitated an unusual placement of the plant’s prime movers and unique piping geometry as well. In a typical 4 x 2 plant (where there’s enough room), the two gas turbines (GTs) and one steam turbine (ST) of one power block and the two GTs and one ST of the other are all laid out in a row. At Linden, at one end of the centerline are two GTs and two STs (one in line and the other offset), with the two remaining GTs at the other end. In other words, the configuration is wide rather than long (as the orientation of the white buildings—the power blocks—in Figure 1 makes clear).
Another consequence of the footprint constraint is that Linden has more bizarre piping geometry than all but perhaps six other plants worldwide (Figure 3). The dearth of standard bends and straight piping runs, and the need to have more piping bends than sweeps, raised the cost of construction a bit.
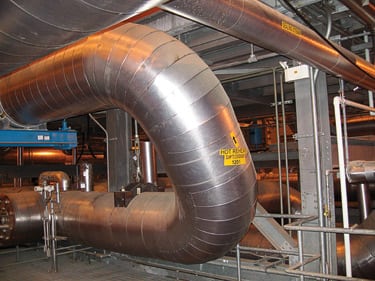
3. Do the twist. An example of the kind of extreme piping bends necessitated by Linden’s limited site footprint. Courtesy: PSEG Power
Another unique aspect of Linden is the placement of its control room. At a typical independent combined-cycle plant, the control room is in a different building than the power blocks. Usually, it’s at grade in the same building as the warehouse. At Linden, the control room is on the third level, at about 75 feet elevation, between and on the back side of the power blocks (Figure 4).
4. Upstairs, downstairs. At Linden, the control room is located on the third level, between the power blocks. Courtesy: PSEG Power
The control room was located there due to the footprint constraint. Though its location improves operators’ access to the steam turbine, valves, and piping at that level, it does necessitate longer trips when making visits to rotating machinery two levels below.
The final, unique aspect of Linden has to do with its location. The plant is connected to two transmission grids of different voltage: 138 kV and 230 kV. In Unit 1, one gas turbine is on the 138-kV system and the other is on the 230-kV system. The unit was split that way to use the injection rights of the old plant. Unit 2 is connected only to the 230-kV grid. PJM uses different pricing mechanisms to pay Linden for the two capacity injections into its grid.
Perseverance pays off
The final (and perhaps most notable) aspect of the Linden plant is that more than five years elapsed between the laying of its foundation and its commercial operation, which began in April 2006.
At Linden, the consequences of leaving equipment (Table 1) exposed to the environment for extended periods of time due to construction delays was far worse than they would have been at a desert site, because the plant is surrounded by a saltwater marsh and is prone to high-humidity conditions.
1. Key suppliers to the Linden project. Source: PSEG Power
Having never dealt with construction of a plant whose site is exposed to salt water mist, PSEG didn’t realize the extent of the corrosion until preparing to run the equipment. As a good utility practice, PSEG decided to inspect the majority of the station’s rotating equipment to mitigate any possible impacts of the extended construction delay. All major pumps—including the circulating-water pumps—were removed, inspected, and returned to original equipment manufacturer (OEM) specifications. All of the GE prime movers were inspected and reconditioned to OEM specs as well. This paid huge dividends for Linden, whose performance has been exceptional since beginning commercial operation in late April of this year (Table 2).
2. Linden Generating Station’s key performance indicators (YTD as of May 31, 2006). Source: PSEG Power
Linden was originally scheduled to be commissioned in the third quarter of 2002. Although some basic systems were validated in 2004, commissioning didn’t begin in earnest until 2005. Necessary tasks weren’t done at the typical 80 hour/week pace because, at that point, the project had become more cost- than schedule-driven.
If there’s a moral to Linden’s cautionary tale/success story, it’s this: Given enough time and money, you can achieve the desired results by learning from your mistakes.