Getting to the root of lube oil degradation problems
The objective of a root cause analysis (RCA) is to identify what happened, why it happened, and what can be done to prevent it from happening again. RCA entails examining the problem and considering evidence from different perspectives. Oil analyses using as many technologies as possible (Table 1) can play a crucial role in the RCA of the failure of lubricated machines. Vibration analysis, thermography, ultrasonic analysis, metallurgical analysis, equipment/component inspections, and operating histories are among the most valuable sources of this kind of data.
|
Table 1. Prioritizing lube oil degradation tests. Source: Analysts Inc.
|
Fluid degradation is responsible for many kinds of lubricated equipment failures. Lubricants are subjected to a wide range of conditions—extreme heat, air, incompatible gases, moisture, contamination by dirt and wear particles, process constituents, radiation, and inadvertent mixing with a different oil—that can degrade their base oil and additives. Changes in viscosity and the development of insoluble particulates are among the first oil degradation problems to affect equipment performance. Therefore, it is vital that appropriate diagnostic analyses be performed to detect these conditions in critical and sensitive lubrication systems.
Italian job
The Italian economist Vilfredo Pareto observed that the unequal distribution of wealth in 19th-century Europe could be stated as follows: 20% of the people own 80% of the wealth. Pareto’s rule of thumb has since been applied to countless situations—including equipment reliability, where 20% of equipment failures indeed account for 80% of total losses. A good manager understands that having the right knowledge and tools to eliminate that critical 20% represents a big opportunity for reliability improvement.
RCA has been bandied about in lubrication circles for several years. However, in the authors’ experience, it is a tool that few people use correctly. RCA should be performed on chronic problems or failures that recur and often become more serious over time. Yet, most lubrication-related RCA is based on a rudimentary analysis of the oil and some poor assumptions.
The failure to correctly identify a root cause is typically not due to a lack of knowledge on the part of the individual or team tasked with the RCA. In fact, in many cases too much expertise is the problem, because it may lead the investigation in a predetermined direction. To be sure, a person or team chosen to conduct a RCA should have expertise in multiple disciplines and training and experience in RCA. But they should also be persistent and have an engineer’s objectivity. False assumptions and predetermined conclusions are the primary reasons why root cause analyses end without soundly documented results or correct findings.
An RCA must begin with an understanding of the problem and a list of all of its possible causes, however remote (Figure 1). Care should be taken not to assign blame for the failure at this point in the investigation. For each potential root cause, experiments and tests should be devised to test its potential existence. Keep in mind that using data to prove a theory false (the devil’s advocate approach), is as viable as taking the normal, causative approach—because that data can eliminate incorrect assumptions.
|
1. The right path. An example of the root cause analysis methodology at work. Source: Analysts Inc.
|
Slippery slope
Analyzing lubricants for degradation is a cornerstone of many machinery condition-monitoring programs, and RCA is a powerful tool in the analysis toolbox. Measuring chemistry changes and detecting insoluble contaminants in the lubricant is the first step in identifying fluid degradation, which in turn is an important part of a lube oil failure RCA.
Oil analysis professionals should already be familiar with the priority list of fluid-testing techniques and procedures presented in Table 1. For those less conversant with fluid-testing options, the available tests are categorized as primary, secondary, and "other useful." Cross-check these tests against some of the common fluid degradation mechanisms listed in Table 2 and shown in Figure 2 to help in the selection process. Consult your fluids professional to determine which tests are right for you.
|
Table 2. The relationship between oil analyses and degradation mechanisms. Source: Analysts Inc.
|
|
2. One step at a time. Selecting the correct analytical tools to assess lubricant degradation is a key step in employing RCA. Source: Analysts Inc.
|

Usually, it’s impossible to pick a solution to a problem before it is identified. Oil analysis is an exception: A well-designed program can select the optimal testing regimen (whether performed in-house or outsourced) for the specific needs of your plant.
When attempting to solve a nagging or catastrophic lube oil–related problem, it’s tempting to jump quickly to a solution based on conjecture or a rush to get the plant back on-line. The RCA process is designed to help you resist the temptation to skip steps or make unsubstantiated assumptions. O&M professionals often find, inexplicably, that although there "wasn’t time" to fix a problem once and for all, there was time to fix it again.
Following are two case studies that illustrate the points outlined above.
Case study 1: Hydraulic fluid degradation
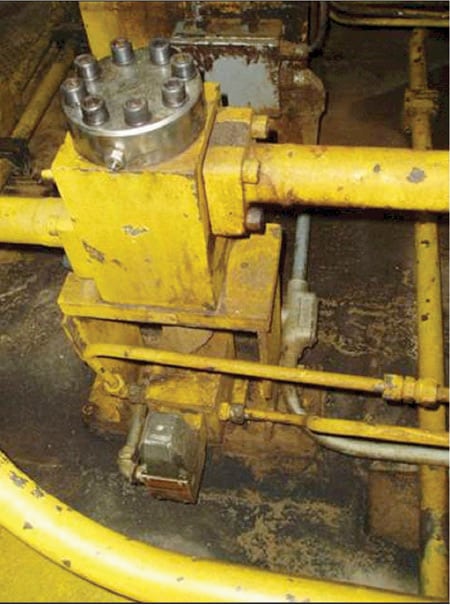
A plant that manufactures particle board used water-soluble oil in its high-pressure hydraulic system. The hydraulic oil was 98% water, 1.5% soluble oil, and 0.5% AW100 hydraulic oil (used to improve the fluid’s lubricating and rust-prevention characteristics). At one point, large chunks of debris and slimy material began appearing throughout the 7,000-gallon hydraulic system and causing clogged filters and strainers. This chronic problem ultimately led to the plugging of a poppet-valve (Figure 3), causing the particle boards in the press to cook onto the platens. The ensuing 48-hour catastrophic shutdown of the particle board line cost the plant owner $1 million in lost revenues and cleanup costs.
|
3. Popping mad. The poppet valve that plugged and caused a plant shutdown. Courtesy: Analysts Inc.
|
A team was assembled to identify the problem and get the oil system back in service. Based on the results of an oil analysis using traditional techniques, the team concluded that oxidation was producing insoluble by-products due to oxidation in the fluid. However, the fluid had been drained and replaced just before the catastrophic plant shutdown. Obviously, the root cause of the problem was not correctly identified the first time around.
The team began by developing a detailed analysis of all of the possible contamination sources, including:
- Water used in the system
- The soluble oil
- The AW100 hydraulic oil
- Resin (used in gluing the particle board)
- Debris from plugged hydraulic fluid 
filters
- Debris from air filter debris (potential airborne contaminants)
- Debris from strainers
- Debris separated from oil
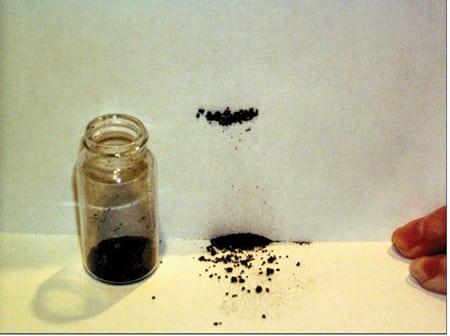
The second time around, the tests of the fluid included physical and chemical separation methods, Fourier transform infrared analysis (FTIR) characterization, scanning electron microscopy/energy dispersive x-ray spectroscopy (SEM/EDX) elemental analysis, inductively coupled plasma (ICP) testing, and thermogravimetric analysis (TGA) to identify and characterize all the contaminants and fluids. The organic material consisted primarily of oxidation products and phosphates. The inorganic material (Figure 4) was identified as magnetite (iron oxide).
|
4. Attractive nuisance. A magnet behind a piece of white paper demonstrates the magnetic properties of the insoluble residue identified as magnetite (Fe3O4). Courtesy: Analysts Inc.
|
Chemical analysis found that the debris consisted of about 20% iron oxide, 20% water, and 60% oxidized hydrocarbon products. The team concluded that there were two causes of debris formation in the system. The first was oil oxidation, the same cause found earlier. But the second source was newly identified—an unacceptably high level of iron oxide in the pond water used to blend the hydraulic fluid mixture. Once in the hydraulic system, the iron was oxidized to iron oxide. Other detected contaminants, such as silicon and calcium, also were traced to the pond water.
Further analysis determined the root cause of the filter plugging was likewise the high level of iron entering the system and collecting on the filters as insoluble iron oxide. The elevated iron content acted as a catalyst, causing oxidation of the hydraulic fluid. This fluid was being oxidized so severely that it was producing an oil-insoluble tar-like substance.
The lubricant contained the additive zinc dialkyl-dithiophosphate (ZDDP), which—in addition to being the antiwear portion of the hydraulic oil—also was supposed to provide antioxidant protection. Because ZDDP additives are unstable in an aqueous environment, there was no oxidation control system in the lubricant. The ZDDP decomposed to phosphate, which was observed in the debris and was unable to control the oil’s oxidation. This accelerated the oxidation by the iron, now identified as a second root cause.
After reading the team’s report, the plant’s maintenance staff drained and cleaned the hydraulic system twice and recharged the system with purified water. The plant also discontinued the use of the ZDDP-containing AW100 in the hydraulic fluid and installed a system to remove the iron from makeup water. Taking these actions ended the formation of deposits, and the hydraulic system has run without incident since.
Case study 2: Fluid degradation in a frame gas turbine
A large frame gas turbine used for peaking at a power plant developed chronic valve-sticking problems in its hydraulic circuit. Small variances in valve performance were enough to cause the turbine control system to trip the unit several times.
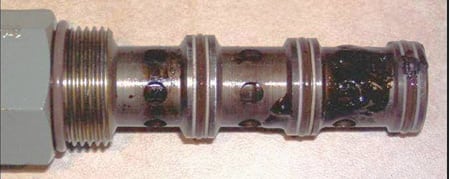
During one of the outage inspections, it was noticed that one of the sticky valves’ spools was covered in varnish (Figure 5). Plant staff assumed that the varnish was the result of oil oxidation in the extremely hot gas turbine enclosure. The remedy chosen was to install an electrostatic oil cleaner. Although valves stuck less frequently after the cleaner was put in, the problem wasn’t eliminated. Plant management then decided to conduct a root cause analysis to identify the real culprit and put an end to the sticking once and for all.
|
5. Sticky situation. Valve body with splotches of varnish caused intermittent outages of a frame gas turbine. Courtesy: Analysts Inc.
|
To begin the analysis, engineers drew a process flow diagram of the turbine’s lubrication system, highlighting temperatures, pressures, and flow rates throughout. Next, they took valves and filters from strategic locations throughout the system and inspected them. Then, they subjected the oil, oil insolubles, and varnish formations to several analytical tests, including quantitative spectrophotometric analysis (QSA), physical and chemical separation methods, and FTIR characterization. Finally, the engineers obtained operational data and oil samples that coincided with turbine start-ups and shutdowns and analyzed them.
When all this information was analyzed simultaneously, several things became evident:
- The turbine oil had almost completely depleted the antioxidant system.
- Infrared analysis indicated strong evidence of thermal degradation in addition to oxidation (Figure 6). This suggested that the oil’s temperature had at some point risen above 572F—hot enough to crack the hydrocarbon molecule.
- The electrostatic oil cleaners had been successful in controlling the amount of oxidative components and insoluble levels.
- The oil had a very high varnish potential (the key finding of the QSA test).
- The varnish material was organic and had a melting point between 130F and 180F.
- No insoluble carbon residue was found in the varnish material.
- The reservoir temperature was 130F during operation.
- The oil cools down as much as 50F during peaking cycles in some of the hydraulic circuit lines.
- The varnish had consistent chemistry throughout the system, regardless of where it formed.
|
6. Final exams. Differential infrared spectra identify changes in chemistry of used oils as compared with new oil. Source: Analysts Inc.
|
Significant amounts of varnish formed on the effluent side of the "last chance" filters, so chunks of varnish were flowing downstream. This became evident during an inspection of the filters (Figure 7), which pointed to an internal mechanism producing the varnish.
|
7. More than skin deep. Although the outside of the filter was fairly clean, the inside was heavily varnished. Source: Analysts Inc.
|
The three primary causes of thermal degradation in a gas turbine are hot spots, microdieseling, and electrostatic spark discharge (ESD). Based on the location of the varnish formation and the lack of carbonaceous residues, microdieseling and hot spots were eliminated as potential root causes. The presence of varnish only on the inside of the filter eliminated the possibility of insoluble contaminants precipitating out of the oil at cooler temperatures during peaking. If this were occurring, one would expect to see varnish primarily on the outside. This left ESD as the likely cause of the varnish formation and fluid degradation. All of the analytical results and observations pointed to this degradation mechanism, and there were no data that eliminated the chance of this occurrence.
Based on the finding that ESD was occurring in the last-chance filters before the valve blocks, the plant decided to heat trace one of the lines that left the controlled atmosphere of the lube oil skid and was exposed to the outside elements. Heat tracing this line maintained the temperature of the oil at 120F, regardless of weather. This had an immediate positive effect on the valve sticking and varnish formation in this valve block, indicating that the temperature of the fluid had a direct impact on the occurrence of ESD. The hotter temperature affects several factors that cause ESD, one of which is viscosity. The reduction of the viscosity of the fluid reduces the flux across the filter and its ability to influence ESD. The plant is currently heat tracing the remaining lines in order to further reduce ESD incidents in other valve blocks.
By combining data from operating events with oil analysis, the plant was able to determine that ESD was occurring during turbine start-ups, when the oil in the lines was at its coolest.
This article was adapted from a paper presented last May at the Lubrication Excellence 2006 Conference and Exhibition in 
Columbus, Ohio.
—Brian T. Thompson is the laboratory manager at Analysts Inc., a 47-year-old consultancy specializing in oil and fluid analysis. 
He can be reached at [email protected]. Greg J. Livingstone is director of fluid technologies at EPT and can be reached at [email protected]. Dave Wooton is president of Wooton Consulting; he can be reached at [email protected].