Gas Glut Remains, Prices Keep Falling

The global gas glut showed no signs of lessening as the industry moved into 2012, even as gas usage continued to climb. U.S. inventories at the end of the first quarter are projected to hit levels not seen in more than 20 years.
According to the U.S. Energy Information Administration (EIA), U.S. natural gas use for power generation rose 7%, or about 515 billion cubic feet (Bcf), between 2009 and 2010 (Figure 1). Total natural gas deliveries to consumers grew about 4% to around 22 trillion cubic feet (Tcf) for 2010, while use in the industrial sector was up by 6%. The EIA also projected in its 2012 Annual Energy Outlook Early Release (AEO) that gas demand for electricity generation would grow from 7.4 Tcf in 2010 to 8.9 Tcf in 2035.
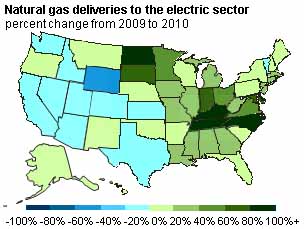
1. Natural gas usage for power generation showed strong growth between 2009 and 2010 in most areas, particularly in the East and Midwest. Source: EIA
But this growth did little to offset the flood of new production. According to the EIA, working natural gas inventories as of October 31 were 3,810 Bcf, following an exceptionally large buildup at the end of the 2011 injection season. From September 1 through October 31, net injections into underground storage facilities totaled 858 Bcf, more than 45% higher than the five-year average injections of 591 Bcf for that same time period, driving inventories to record levels.
Inventories Hitting Record Highs
The boost in injections during September and October resulted from lower demand due to mild weather across much of the U.S., coupled with continued strong production. The EIA projected in late 2011 that storage operators will withdraw 2,000 Bcf from storage during the 2011-2012 winter heating season. This level of withdrawals would place stocks as of March 31 at 1,809 Bcf, the highest end-of-March level since 1991. Yet by January, there were signs even this estimate might be conservative, as storage levels in early 2012 remained well above historical levels, sitting at 2,595 Bcf for the week ending February 17. That put the industry on track to crack the all-time high of 2,148 Bcf set in 1983.
Gross production through October was up 6% over 2010, much of it the result of strong growth in key areas such as the Marcellus and Eagle Ford shale formations. The daily production from Marcellus doubled over 2010. However, the EIA also substantially cut its estimate of recoverable reserves in the Marcellus field, from 410 Tcf to 141 Tcf, largely because the drilling rush provided a wealth of new data for assessment.
Prices Have Plummeted
As a result of this flood of natural gas, wholesale spot prices in most areas of the U.S. fell almost 10% from the previous year. Prices at the Henry Hub, a key benchmark location for pricing throughout the U.S., fell 9% to about $4/MMBtu in 2011, the second-lowest annual average price since 2002 (Figure 2). Natural gas futures prices in November were likewise at their lowest levels in a decade, and spot prices followed suit by dropping under $2.50/MMBtu in January.
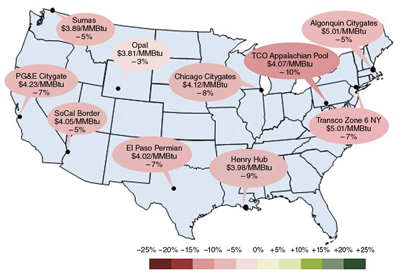
2. Spot prices for natural gas fell in every major trading location in 2011. Percentages are the average spot natural gas price percentage change from 2010 to 2011. Source: EIA
Despite the precipitous drop over past year, some industry observers see no sign of a bottom, in part because strong demand for natural gas liquids from Eagle Ford and other fields (due to still-high oil prices) means a certain level of steady gas production will likely continue no matter the market.
Some experts have begun warning that prices could fall to $0.00/MMBtu—or even into negative territory. The imbalance between supply and demand over the current mild winter has raised the specter of storage inventories hitting their capacities by early fall, an event that could force some companies to begin giving away their gas.
A Bottom May Be in Sight
Even so, there were some signs that the free-fall in gas prices would eventually arrest itself. On Jan. 20, the Department of Energy authorized Cameron LNG, a subsidiary of Sempra Energy, to export up to 1.7 Bcf per day from its Cameron Parish, La., facility to countries possessing free-trade agreements with the U.S. The EIA had predicted a day earlier that increased liquefied natural gas (LNG) exports would cause U.S. prices to rise as gas exporters would be able to take advantage of much higher spot prices in Europe and Asia, where gas prices are often tethered to the price of oil by contract.
Also in January, there were signs that producers were looking for ways to cut back their output. Independent producer Chesapeake Energy announced late in the month that it is planning to idle rigs and slash its 2012 drilling budget. Chesapeake is one of the largest drillers working the Marcellus field. Another major Marcellus operator, Talisman Energy, has also scaled back its Marcellus drilling plans. In February, Canadian producers Progress Energy and Encana announced similar cutbacks.
Over the longer term, it has become clear that shale gas has reset the traditional thinking on U.S. natural gas usage. The EIA predicted in AEO2012 that the U.S. would become a net gas exporter in 2020 (Figure 3). Net LNG exports are projected to reach 1.1 Bcf per day in 2016 and 2.2 Bcf per day by 2019. The U.S. should become a net pipeline exporter of natural gas by 2025, with net pipeline imports from Canada falling 62% and net pipeline exports to Mexico growing by 440% by 2035.
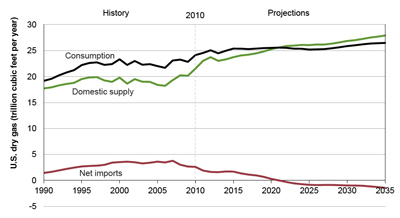
3. The EIA predicts that increases in production will shift the U.S. to a net gas exporter in 2020. Source: EIA
Meanwhile, according to EIA estimates, about 11.3 Bcf per day of new pipeline capacity came online in 2011. About 2,400 miles of new pipe was added to the grid as part of over 25 projects. Some of the key expansions included the Oregon-Wyoming Ruby Pipeline, the Tennessee Line 300 project, and the Florida Gas Transmission Phase VIII Expansion project. However, the gas glut has pushed the proposed Alaska natural gas pipeline project onto the back burner, perhaps permanently, as low prices and large inventories in the continental U.S. make it more economic to export Alaskan gas to Asia.
—Thomas W. Overton, JD is POWER’s gas technology editor. Follow Tom on Twitter.