Design of Experiments Reduces Time to Market
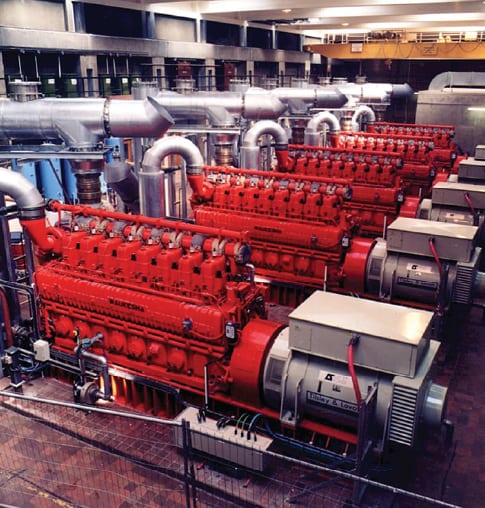
Dresser Waukesha is a familiar name associated with large, gas-fueled stationary engines for power generation and gas compression applications around the world. Each new project location presents a unique set of site variables that must be taken into consideration—such as fuel quality, air/fuel ratio, temperature, humidity, altitude, load, and exhaust after-treatment—when providing the customer a meaningful performance guarantee. To fully characterize every engine option with such a wide range of fuel types and quality and in widely varying environmental conditions across the global is an impossible chore (Figure 6).
 |
| 6. Sweet sixteen. In this typical cogeneration plant consisting of five 16-cyclinder gas engines, heat is recovered in an exhaust heat-recovery unit and from the jacket water and lube oil. Source: U.S. Department of Energy |
The Brute Force Approach
In the past, developing reliable predictions of engine performance was a painstaking, expensive, and time-consuming manual process. The biggest challenge was using regression analysis to develop equations based on experimental data that described the relationship between the factors (independent performance variables) and the responses (dependent performance data). Engineers ran large numbers of performance computer models where one factor was varied over a range of values while the other variables were held constant, and then recorded the results. Then the next factor was varied, and so on.
When the tests were completed, engineers used statistical analysis, previous data, experience, and no small amount of intuition to estimate actual performance under actual field conditions. This approach required manually fitting the different equation forms to the data set, but the process took weeks and occupied considerable time on the part of engineers who were needed for other tasks.
Predictably, the accuracy of this approach was limited by its inability to account for interdependencies between each of the factors that aren’t considered when using this brute force approach to predicting engine performance in unpredictable circumstances.
The Lean Approach
A number of years ago, the Dresser Waukesha development team adopted the design of experiments (DOE) approach to increase the accuracy of performance estimates and reduce the number of required tests. DOE, one tool in the lean engineering and manufacturing toolbox, is a very useful statistical tool when the number of factors is large and there are interdependencies between the factors. By varying the values of all factors simultaneously, a statistically validated estimate of the results for every possible combination of the factors is possible. This analysis approach determines not just the primary effects of each factor but also the interactions between the factors. DOE also requires far fewer experimental (time in the test cell) iterations than the traditional one-factor-at-a-time approach and makes it possible to quickly identify the optimal values for all factors in precisely the right combination.
“We were convinced of the value of DOE but needed a tool that would enable us to reduce the time required for data analysis,” said Dennis Spaulding, senior development engineer for Dresser Waukesha. “We looked at a number of statistical software packages that offered DOE capabilities but they typically seemed to be designed more for statisticians than engineers. They offered a wide range of statistical capabilities but required that most aspects of DOE experimental design and data analysis be performed manually.” Ultimately, the company selected Design-Expert software from Stat-Ease Inc.
Design-Expert automates the experiment design and statistical analysis aspects of DOE behind an easy graphical user interface. With the software, the time necessary for data analysis is reduced by about two-thirds, which significantly speeds up the process of bringing new engines to market.
To prepare for a recent introduction of a new engine, Spaulding designed an experiment to evaluate its performance over a wide range of expected conditions. He entered the factors and categories of desired results into Design-Expert and set up the software to design an optimal experiment to fit a user-selected quadratic model. Design-Expert generated an experiment design requiring just 84 runs in the test cell. Compare that to the more than 3,000 runs the brute force approach requires, assuming all combinations of just five performance variables are tested.
Dresser Waukesha technicians report that each experiment in the test cell took between one and two hours, including setup, bringing the engine up to operating temperature, stabilization, performing measurements and cooling down the engine. As each run concluded, results were entered into Design-Expert.
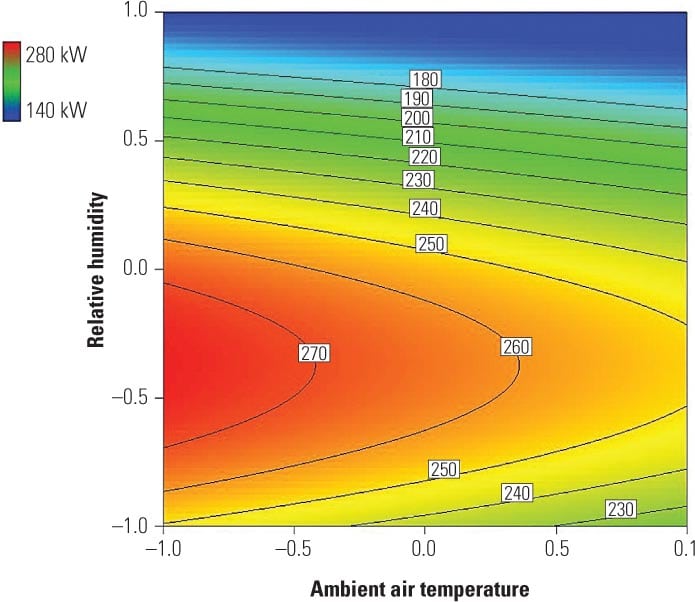
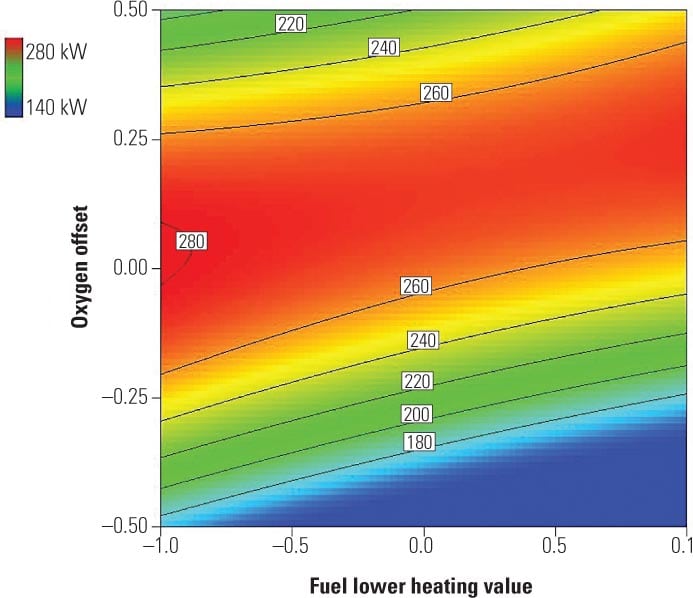
In a matter of seconds, the software generated equations that best fit the runs performed up to that point. Engineers viewed the results to identify trends as well as look for data points that did not fit into the model. In several cases, technicians were asked to rerun points that did not fit well. Design-Expert software was then used to develop models of engine performance, including maximum power output, engine emissions, and fuel consumption that fully take into consideration all the interactions between the factors. These models were then entered into a spreadsheet, which is now used by the application engineering group to predict the performance characteristics of the engine at a particular customer site. Figures 7 and 8 illustrate a small portion of the typical results from those tests.
 |
| 7. Maximum power as a function of humidity and inlet air temperature. The DOE results map illustrates the power predicted for an engine for a given set of site conditions as a function of humidity and inlet air temperature in coded values. This prediction is important to understand because the ambient conditions from site to site, or even at a single site, can vary greatly. The figure shows that the highest power output of the engine is achieved when the inlet temperature and humidity are both low. Inlet air is denser under these cool and dry conditions than when it is hot and damp, allowing the engine to induct more air to burn with more fuel. The data are shown in terms of percent variation from a design point for proprietary reasons. Source: Dresser Waukesha and Stat-Ease |
 |
| 8. Maximum power as a function of fuel heating value and air/fuel ratio. The DOE results map illustrates the predicted power as a function of fuel heating value (LHV) and air/fuel ratio (O2 offset) in coded values. Since the engine can be applied in applications that run on low-energy-content landfill or digester fuel gas in which the fuel quality can fluctuate, it is also important to understand how the fuel heating value and air/fuel ratio affect maximum power. For this engine, the air/fuel ratio required to reach the maximum power output changes with the lower heating value of the fuel. The lower the energy content of the fuel, the richer the air/fuel ratio must be to reach the same power output. Data are shown in terms of percent variation from a design point for proprietary reasons. Source: Dresser Waukesha and Stat-Ease |
“The DOE process, coupled with the user-friendly Design-Expert software has helped us improve the accuracy with which we can predict operating characteristics of our engines at specific customer sites while increasing the speed with which we can bring new engines to market,” Spaulding concluded.
—Contributed by Dresser Waukesha and Stat-Ease.