CO2 Source and Sink Tracking Improving
Many opponents of climate change policies and regulations argue that it is unfair to penalize some sectors — like power generation — more heavily than others when it’s difficult to prove precisely where specific greenhouse gas (GHG) emissions are coming from, where they’re going, and what effect they are having. Toward the ends of scientific understanding and sound public policy, scientists are making progress in isolating GHG sources and sinks.
The work began 50 years ago when atmospheric scientist David Keeling started running the world’s first CO2 -measuring observatory, at Mauna Loa, Hawaii. According to a Dec. 2nd New York Times story, "Carbon Detectives Are Tracking Gases in Colorado," an expanding combination of atmospheric and land-based measuring techniques is allowing scientists to "quantify more precisely the sources and sinks of CO2. They also better understand how heat-trapping gases vary over time and space, not just globally but on continental and even regional scales."
Tall towers, like a 984-foot one on the eastern plains of Colorado, are being used to support narrow tubes that take continuous samples of CO2, methane, and other GHGs and send the data to analyzers nearby. According to Dr. Arlyn Andrews, an atmospheric scientist at the National Oceanic and Atmospheric Administration (NOAA) in Boulder, "We’re able to detect the whole mix of emissions here — what comes from automobile traffic, from industry, from residential development and from agriculture."
The Times story noted that "scientists have to tease out the information from disparate and often contradictory sources. The key task is measuring the sources, or emissions, of these planet-warming gases, and the ‘sinks’ — forests, cropland and oceans that absorb carbon….
"By applying the various methods and checking them against each other and against computer models, scientists are also more accurately distinguishing certain human-caused greenhouse gases from those that stem from natural fluctuations in terrestrial and ocean ecosystems.
"But," the Times story continued, "uncertainty remains high…. For instance, researchers think about half of the CO2 emitted into the atmosphere gets absorbed by oceans and land, but they do not know precisely where the gases come from and where they end up. This knowledge gap has serious policy implications; until it becomes clear where emissions are going, it will remain difficult to have verifiable credits for sequestering carbon.
" ‘We need to make sure that carbon markets are affecting climate change, not just putting money in the hands of some companies and people,’ said Lisa Dilling, an assistant professor of environmental science at the University of Colorado, Boulder.
"A vexing challenge is that surface inventory assessments — based on measuring forests, agricultural fields and smokestack emissions, for instance — generally do not agree with atmospheric measurements."
"We’ve got to close the carbon budget to know precisely what’s going where," Kevin Gurney, an assistant professor of earth and atmospheric sciences at Purdue University in Indiana, was quoted as saying.
Toward that goal, last April, Dr. Gurney started the Vulcan Project (named after the Roman god of fire). According to the Vulcan web site, which includes research data and maps (www.purdue.edu/eas/carbon/vulcan/index.php), "The Vulcan project has achieved the quantification of the United States fossil fuel CO2 emissions at the scale of individual factories, powerplants, roadways and neighborhoods. We have built the entire inventory on a common 10 km grid to facilitate atmospheric modeling. Vulcan is available at the hourly timescale for the year 2002 {Figure 1]. In addition to improvement in space and time resolution, Vulcan is quantified at the level of fuel type, economic sub-sector, and county/state identification.
"Work is underway to complete similar inventories for Canada and Mexico, to include CO and NOx emissions, and incorporate biotic-based fuels."
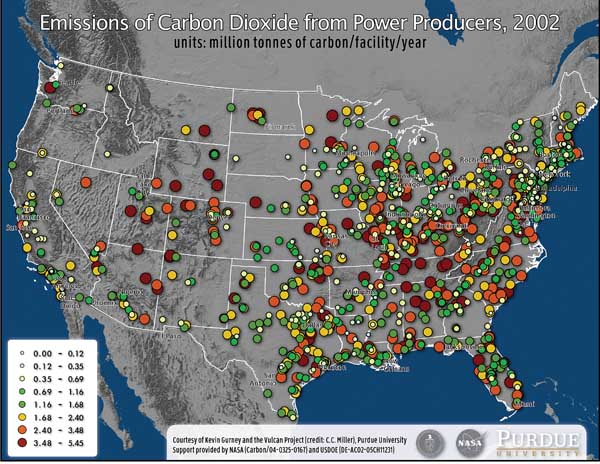
1. Vulcan data. This image from the Vulcan Project shows the location and magnitude of CO2 emissions from major power producers under the Continuous Emissions Monitoring program of the Emissions Trading System. The Vulcan Project is a NASA/DOE-funded effort under the North American Carbon Program to quantify North American fossil fuel CO2 emissions at space and time scales much finer than has been achieved in the past. Source: Purdue University
Another carbon budget-mapping tool for "policy makers, industry, scientists, and the public" is CarbonTracker (www.esrl.noaa.gov/gmd/ccgg/carbontracker/), a data analysis system begun last year by Pieter Tans, a senior scientist at NOAA’s Earth Systems Research Laboratory and his colleagues at NOAA. The online system shows how CO2 ebbs and flows across continents and how that varies year to year.
It was Tans who started the tall tower network in 1992. That network has, according to the Times story, "drastically improved on air samples taken from small airplanes. And the towers cover a broader area than shorter, land-based instruments like so-called flux towers that measure how many tons of CO2 flow in and out of a specific plot of land, roughly within a square kilometer."
In the new year, the National Aeronautics and Space Administration will launch the first carbon-scanning satellite: the Orbiting Carbon Observatory (http://oco.jpl.nasa.gov/).
"Each day," the Times reported, "the satellite will orbit Earth 15 times, taking nearly 500,000 measurements of the ‘fingerprint’ that CO2 leaves in the air between the satellite and Earth’s surface. The data will be used to create a map of CO2 concentrations that will help scientists determine precisely where the sources and sinks are — showing differences in trace gases down to a 1 part per million precision against a background of 380 parts per million CO2 equivalent."
Many scientists working in this field hope their work will lead to informed policy regarding climate change, such as expected legislation to control CO2 emissions.