Benchmarking Nuclear Plant Capital Requirements
The EUCG Nuclear Committee’s primary goal is to optimize the costs and reliability performance of participating plants by publishing for its members a comprehensive database of performance metrics and best practices derived through surveys of its membership. Earlier reports examined staffing and performance data. In this exclusive EUCG report, we examine nuclear plant capital requirements.
Construction of new nuclear power plants has received considerable attention as the U.S. evaluates different energy options to meet future demand. Meanwhile, the 104 reactors operating in the U.S. today are continually adding to capacity while providing approximately 20% of U.S. electricity generation (in 2009). By extending the lives of the current U.S. nuclear fleet through the renewal of commercial licenses for an additional 20 years, and by completing projects to increase rated power output, owners are ensuring that their plants will continue to be a significant contributor to U.S. energy production for many years to come.
The Nuclear Regulatory Commission (NRC) has already granted license extensions to 59 reactors, and 39 additional applications are pending or have been publicly announced. The NRC also reports that nuclear plant uprates of 3,526 MWe are either under review or applications are expected by 2014. Longer plant lives and major uprate projects will result in additional capital expenditures necessary to support the industry’s increasing capacity factors, improvements in safety and security, and future regulatory requirements.
The Nuclear Industry Benchmarking Culture
In light of the recent economic environment and low forward price curves for natural gas and power prices, the nuclear industry is more focused than ever on effectively managing plant capital investments to prevent concerns about future cash flows, while prioritizing safe and reliable operations. As part of the nuclear industry culture, nuclear power generators are turning to established performance measures to compare their capital cost performance with that of their peers. By benchmarking industry performance, operators can help identify best practices and continuous improvement programs to implement during the planning process for future capital projects and long-range strategic forecasts.
The EUCG Nuclear Committee’s Role
The EUCG Nuclear Committee helps nuclear plants manage their capital costs by providing reliable benchmarking data. The committee’s primary goal is to optimize the costs and reliability performance of participating plants by publishing for its members a comprehensive database of performance metrics for comparing nuclear plant costs, staffing, and performance data and best practices derived through membership surveys. “Benchmarking Nuclear Plant Operating Costs” (November 2009) and “Benchmarking Nuclear Plant Staffing” (April 2010) were the subjects of previous POWER articles. This article examines the third database metric: capital investment levels at U.S. nuclear power plants.
EUCG data are shared on a “give-to-get” basis, meaning that the data are only available to members that participate by providing their plant data. Committee membership includes representatives from all of the U.S. nuclear plants and participating companies in Canada, China, France, Japan, Romania, and Spain (see sidebar).
The EUCG’s Nuclear Integrated Information Database (NIID) was originally developed in 1986 and is updated annually by its members. The collection of capital information in the EUCG database has evolved over time. In 2001, capital data was requested to be shown separately in the NIID due to its importance. In 2006, the capital portion of the database was upgraded to collect additional information. Today, the following five sections of the capital database are available:
- On a company level:
1. Capitalization size thresholds
2. Capitalization costs included
- On a plant level:
3. Annual capital expenditures by specific work bins (examples of work bins include enhancements, infrastructure, regulatory, and information technology)
4. Capital costs—major projects data: projects over $10 million of annual cost
5. Capitalization policy questions
With details regarding what type of costs are capitalized, thresholds of those costs, and any policy differences between plants, the NIID contains capital costs data that can be analyzed to better understand a plant’s performance relative to peers and industry trends.
Comparing Plant Capital Costs and Analyzing Trends
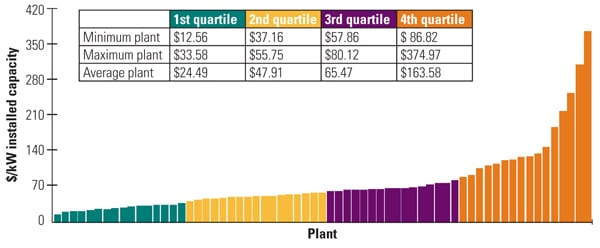
Figure 1 shows the 2009 total capital for U.S. nuclear plants based on a $/installed capacity basis. By standardizing the cost over plant capacity instead of using total cost, the data are not skewed by some plants having multiple units and others having a single unit. Plant owners can adjust the criteria to evaluate how their plants compare with international plants, with other reactors of the same type, with plants having the same number of units, and with plants on the same refueling cycle.
 |
| 1. Total capital investment (2009). The data for U.S. nuclear plants in dollars per installed kilowatt were taken from the EUCG Nuclear Committee’s Nuclear Integrated Information Database. Data were then sorted and arranged in quartiles for ease of analysis. Note the year-on-year increase in capital investment over the 2008 data shown in Figure 2. Source: EUCG Nuclear Committee |
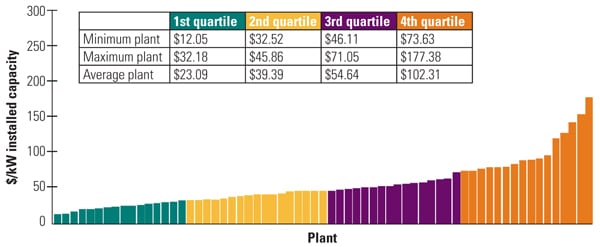
Figure 2 shows the same data, but for 2008, for historic comparison. In general, the trend is a substantial increase in one-year capital costs between 2008 and 2009, as the average plant in the first quartile increased capital spending 6% while the average increases in the other quartiles were 20% or higher. A significant number of large one-time capital costs may have been incurred in 2009 related to major projects, which would magnify the average increase. Segmenting the data to show single-unit plants separately could also reduce the variances caused by one-time capital projects, because a single unit would likely have a smaller installed capacity and therefore would see a greater increase when significant costs occur.
 |
| 2. Total capital investment (2008). Source: EUCG Nuclear Committee |
Given the one-time nature of major capital projects and the variability in capital costs associated with a plant’s refueling outage cycle, a longer data period may be more appropriate for analyzing capital cost trends. Using a five-year average of EUCG data for total capital cost spend (in dollars), the U.S. industry average increased from 2004–2008 to 2005–2009 by approximately 10% and 12% for single- and multi-unit sites, respectively.
Overall, although there are many different ways to view and analyze the data, capital costs for nuclear plants have increased from 2008 to 2009 and appear to be trending in that direction going forward.
The Impact of Major Projects
One of the difficulties in benchmarking capital costs is assessing the magnitude of certain major projects as components of a plant’s total capital spend. If a single-unit plant has a typical annual capital spend of $40 million to $50 million, spending $150 million in one year on steam generator replacements significantly alters that plant’s statistical data. Capital cost per installed capacity, total annual capital, and even a five-year average spend would be heavily influenced by one-time costs that may occur at different times based on when the plant was built, its reactor type, or management decisions.
With the substantial volume of power uprate projects currently in progress, the focus on major projects for benchmarking purposes continues to increase. The EUCG’s NIID allows users to adjust plant capital spend for major projects for comparative analysis. The detail available in the major projects section also provides operators with benchmarking data on the types of projects being performed across the industry and their respective costs. Whether the project is regulatory-driven or designed to enhance capacity, as in the case of an extended power uprate, the major projects section of the capital survey enables users to select and examine capital costs that are most relevant to their particular plant.
The Power of Capital Benchmarking
Nuclear operating and fuel costs, also referred to as nuclear production costs, receive a lot of the attention when discussing the industry’s performance as a low-cost provider of electricity. In a world with lower forward power prices and increasing cash constraints, some of the focus has shifted to benchmarking nuclear capital costs for best practices. As the nuclear industry’s preeminent organization for economic and performance benchmarking data, with the most comprehensive and accurate nuclear industry cost and staffing database in the world, the EUCG provides its members with the tools necessary to analyze their capital needs and compare them with their peers’ capital spending and historical industry trends.
— Mike Kramer ([email protected]) is manager of finance for Exelon Nuclear.